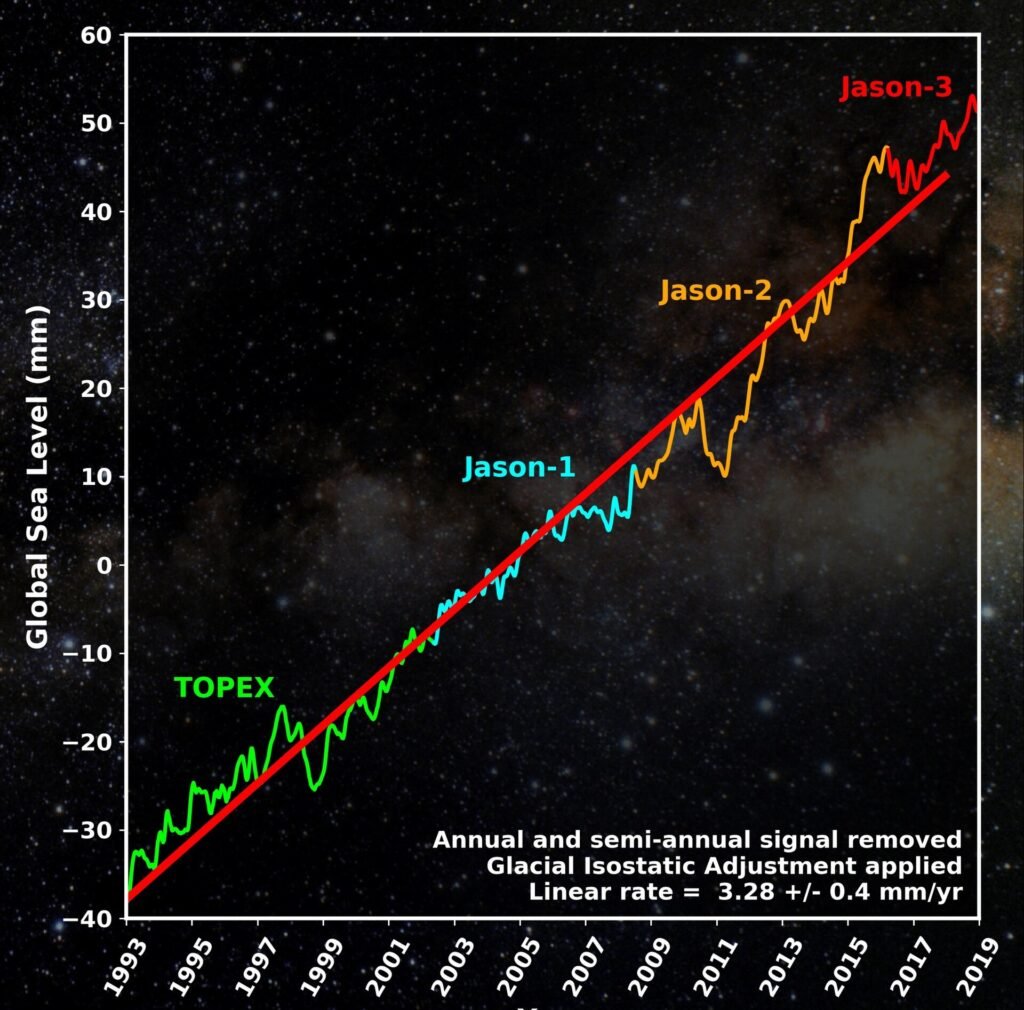
The global ocean is rising, and a NASA-led analysis found that it rose faster than expected in 2024. The result matters because it shows how the average level of the sea is changing year to year, not just over decades. It also changes the answer to a basic question: is the rise coming mostly from melting ice or from warming water?
What is global mean sea level?
Global mean sea level is the average height of the ocean surface across the whole planet, once short-term effects such as tides and waves are averaged out. Tracking the global average, instead of a single coastline, lets scientists see the overall trend. Local sea level can differ from the global figure, because land can rise or sink and currents move water around, so coastal planners also need local data.
How do scientists measure it?
According to NASA’s Jet Propulsion Laboratory, a series of five international satellites provides the record. It starts with the U.S.-French TOPEX/Poseidon mission, launched in 1992. The most recent satellite in the series is Sentinel-6 Michael Freilich, launched in November 2020. The record covers 1993 to 2024, more than 30 years of satellite observations, which makes it one of the longest consistent measures of the ocean’s height.
How fast did the sea rise in 2024?
NASA reports that sea level rose 0.23 inches (0.59 centimeters) in 2024, faster than the expected 0.17 inches (0.43 centimeters). In millimeters that is about 5.9 against an expected 4.3. By our own arithmetic, that is roughly 37 percent faster than expected. NASA also reports that the annual rate of rise has more than doubled since the satellite record began in 1993.
How much has the sea risen since 1993?
The NASA analysis gives a total rise of 4 inches, or about 10 centimeters, since 1993. Dividing that by the 31 years in the record gives an average of about 3.2 millimeters a year, which is our own calculation and not a NASA figure. Seen against that average, the 2024 rate of 5.9 millimeters was nearly double. The gap illustrates how a rate that is speeding up can still produce a modest-looking total.
Sea level vs. storm surge and tides
Three terms are often mixed up. Tides are the daily rise and fall caused by the Moon and Sun. Storm surge is a temporary rise in water level during a storm. Sea level rise is the slow shift in the baseline on which both of those sit. Even a small increase in the baseline means that a given tide or storm surge reaches a little higher than it would have before, which is why a few centimeters of rise matters for low-lying coasts.
What caused the rise?
Sea level rises for two main reasons: land ice melts and flows into the ocean, and seawater expands as it warms. NASA explains that in recent years about two-thirds of the rise came from land ice melting, meaning ice sheets and glaciers, and about one-third came from thermal expansion. In 2024 that balance flipped, and about two-thirds of the rise came from thermal expansion.
- Land ice melt: adds new water to the ocean
- Thermal expansion: the same water takes up more space as it warms
Why does the flip in causes matter?
The change in the mix is a reminder that the ocean has absorbed a great deal of heat. The ocean works as a carbon sink for gases and also takes up heat from the atmosphere, and warm water expands. Land ice melt and thermal expansion both trace back to higher temperatures, which are tied to the heat-trapping effect described in our entry on the greenhouse effect. The NASA analysis was reported by JPL, with comments from JPL’s Josh Willis and NASA Headquarters’ Nadya Vinogradova Shiffer.
How does sea level relate to emissions?
Carbon dioxide from burning fossil fuels is the main driver of recent warming. Our article on global CO2 emissions lays out the latest numbers. Sea level responds slowly, because oceans take a long time to warm and ice sheets take a long time to change. That inertia is why one year, even an unexpected one, does not settle the long-term path, and why researchers keep adding years to the record.
Why does a long record matter?
Sea level changes from year to year because of natural swings in ocean heat and weather patterns. A record of more than 30 years makes it possible to separate those short-term wobbles from the underlying trend. It also lets scientists check whether the rate is steady or speeding up. The NASA analysis answers that question clearly for the long run: the rate has more than doubled since the satellite record began.
What is still uncertain?
A single year can be pushed up or down by natural variability, so scientists compare 2024 with a long record before drawing conclusions. The NASA piece describes the 2024 rise as faster than expected, not as a new permanent rate. The long-term message is clearer: the rate has more than doubled since 1993, and the cumulative rise is about 10 centimeters.
Frequently asked questions
How much did sea level rise in 2024?
About 0.59 centimeters (0.23 inches), faster than the expected 0.43 centimeters, according to NASA.
How much has it risen since 1993?
About 10 centimeters, or 4 inches.
What caused the 2024 rise?
About two-thirds came from thermal expansion of warming seawater, according to NASA.
Is the rise happening at a constant rate?
No. NASA says the annual rate has more than doubled since 1993, and 2024 ran faster than expected.
Which satellites measure it?
A series of five international satellites, starting with TOPEX/Poseidon and most recently Sentinel-6 Michael Freilich.