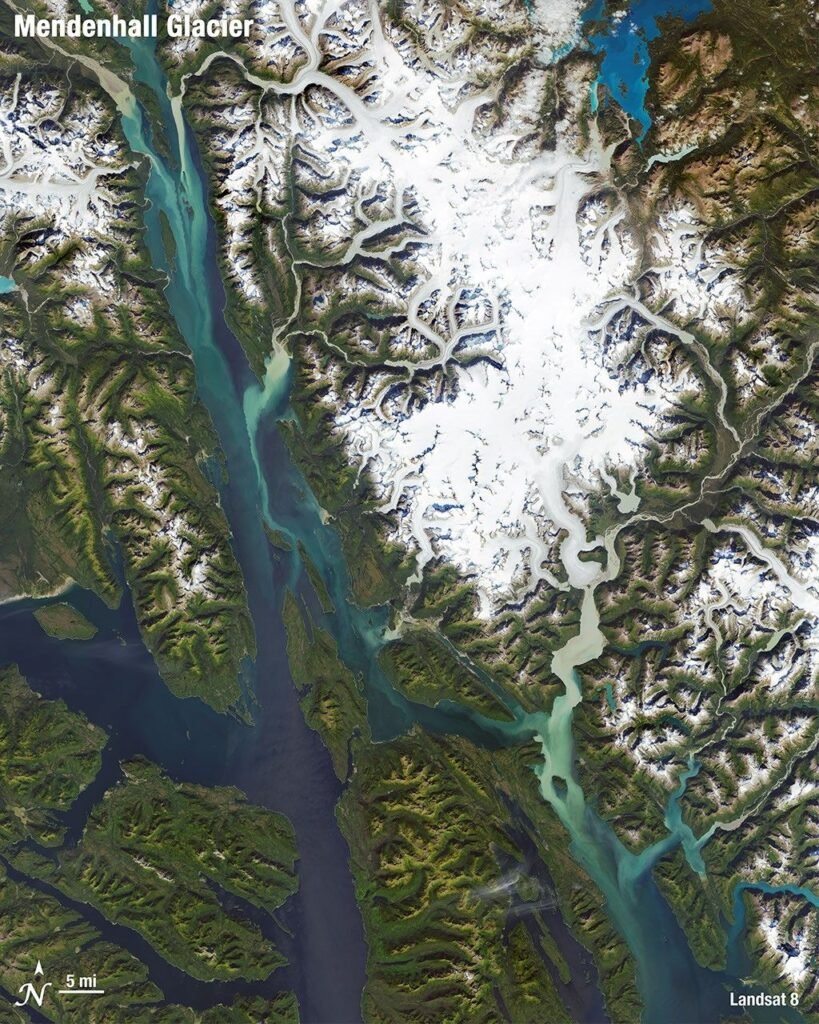
Glaciers are among the clearest measures of a warming climate because they respond to temperature over years and decades. A set of 2026 assessments, reported by the University of Edinburgh and the World Glacier Monitoring Service (WGMS), found that 2025 was among the worst years on record for global glacier loss.
How much ice did glaciers lose in 2025?
Glaciers outside the Greenland and Antarctic ice sheets lost about 408 billion tonnes of ice in the 2025 hydrological year. That raised sea level by about 1.1 millimeters. Michael Zemp, director of the WGMS, described the loss as the equivalent of five Olympic swimming pools of ice every second of the year. The findings were published on April 22, 2026, and draw on satellite observations and glacier mass-change data from national monitoring networks, coordinated by the WGMS.
How has the rate of loss changed?
- 1976 to 1995: under 100 billion tonnes per year
- 1996 to 2015: about 230 billion tonnes per year
- 2016 to 2025: about 390 billion tonnes per year
Six of the highest mass-loss years on record occurred in the past seven years. Since 1975, glaciers have lost about 9,583 billion tonnes of ice, which corresponds to roughly 26.4 millimeters of sea level rise. By our own arithmetic, the average annual loss in the latest decade is more than 3.9 times the 1976 to 1995 figure, which is given only as an upper bound of 100, and about 70 percent higher than in 1996 to 2015.
Key figures at a glance
- 2025 loss: about 408 billion tonnes of ice
- 2025 sea level contribution: about 1.1 millimeters
- Loss since 1975: about 9,583 billion tonnes, or roughly 26.4 millimeters of sea level
- Glacier volume lost in two decades: about 5 percent
- Highest regional volume loss in two decades: about 39 percent, in Central Europe
What is a hydrological year?
A hydrological year is a 12-month period chosen so that it begins and ends when glaciers are at a similar point in their seasonal cycle, usually after the melt season. Scientists use it because calendar years split the snow accumulation and melt seasons awkwardly. The Edinburgh release uses the term for 2025, and this definition is a general one, not quoted from the release.
How do tonnes of ice become millimeters of sea level?
The sources give both numbers, which lets us check the conversion. Dividing 9,583 billion tonnes by 26.4 millimeters gives about 363 billion tonnes per millimeter. Applying that to 408 billion tonnes gives about 1.1 millimeters, which matches the reported figure. This check is our own arithmetic and confirms that the figures are consistent with each other.
How to read the numbers
Two cautions help. The 2025 figure excludes the Greenland and Antarctic ice sheets, which are measured separately and are far larger. Our article on the Arctic Report Card reports a separate figure for Greenland. The second caution is that a year being among the worst on record does not mean it is a one-off. The decade averages show a sustained rise in losses, and six of the highest mass-loss years on record have occurred in the past seven years.
Where is the loss greatest?
The largest losses in 2025 were in Western Canada and the United States, Iceland and Central Europe. Losses were most extreme relative to the 1991 to 2020 baseline in Western Canada and the United States, western South Asia and Svalbard. The largest overall contributors to ice loss were High Mountain Asia, Alaska and the Russian Arctic. Over the past two decades, regional volume losses ranged from about 2 percent in the Antarctic and Subantarctic Islands to about 39 percent in Central Europe.
What share of glacier ice has been lost?
Over the past two decades, glaciers have lost about 5 percent of their total volume. That figure shows why the change is hard to see in a single year but matters over time. A glacier does not regrow quickly once it shrinks, so the loss is effectively permanent on human timescales. This last point is a general statement and is not drawn from the Edinburgh release.
How does this connect to sea level?
Meltwater from glaciers flows to the ocean and adds to sea level. The 2025 loss added about 1.1 millimeters. Our article on NASA’s sea level analysis explains the other contributors, and the Arctic Report Card covers Arctic glaciers in more detail.
Is this the same as what the WMO reported?
Not exactly. The WMO’s November 2025 update reported that glaciers had a third consecutive year of net mass loss in the 2023/24 hydrological year, with a global loss of about 450 billion tonnes, equal to 1.2 millimeters of sea level rise. That is a different year and a different data compilation. Readers should not compare the 450 and 408 figures as if they covered the same period: one is for 2023/24 and the other for 2025.
What is next for measurement?
Scientists are preparing new satellite capability. Professor Noel Gourmelen of the University of Edinburgh’s School of GeoSciences noted the CRISTAL mission, which the European Space Agency and the European Commission plan to launch in 2027. Better measurements should narrow uncertainty in future estimates. For the wider emissions picture, see our report on CO2 emissions and our explainer on climate change.
Frequently asked questions
How much ice did glaciers lose in 2025?
About 408 billion tonnes, adding about 1.1 millimeters to sea level.
Which regions lost the most?
Western Canada and the United States, Iceland and Central Europe had the largest losses in 2025.
Is glacier loss speeding up?
Yes. The average annual loss rose from under 100 billion tonnes in 1976 to 1995 to about 390 billion tonnes in 2016 to 2025.
What is a hydrological year?
A 12-month period timed to the glacier seasonal cycle, so that accumulation and melt are not split across two years.
How much ice have glaciers lost since 1975?
About 9,583 billion tonnes, roughly 26.4 millimeters of sea level rise.