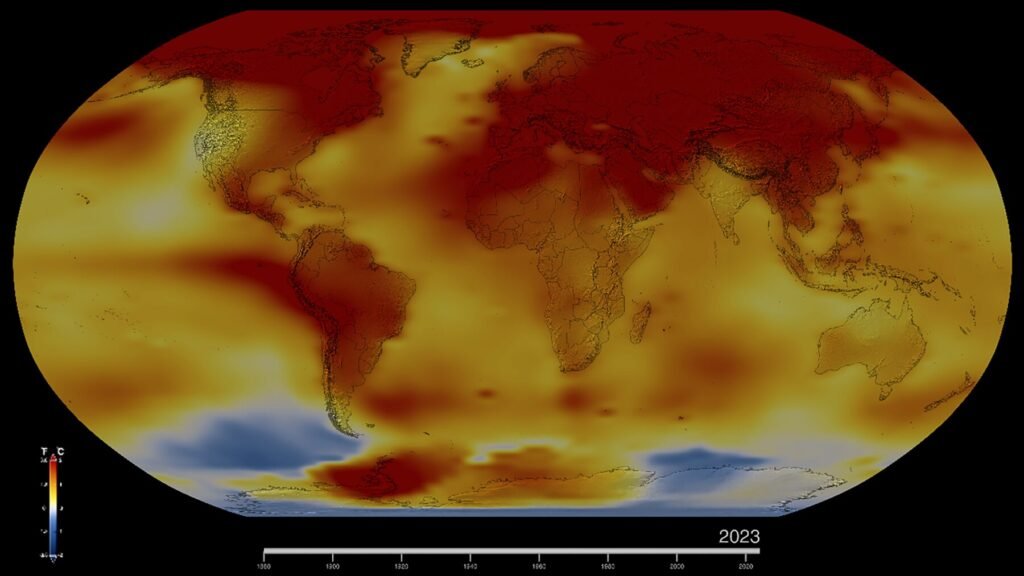
Global temperature records are being set again in 2026. The World Meteorological Organization (WMO) reported on September 11, 2026 that August was the hottest August on record, and the Copernicus Climate Change Service (C3S) reported on October 14 that September was the second-warmest September. The two reports describe a year shaped by a developing El Niño.
How hot was August 2026?
Different datasets give slightly different numbers because they use different baselines. The WMO summarized two of them.
- C3S (ERA5): August was the joint warmest month ever recorded, tied with July 2023, at 1.65 degrees Celsius above the estimated pre-industrial baseline
- NOAA: global surface temperature was 1.32 degrees Celsius (2.38 degrees Fahrenheit) above the 20th-century average, the warmest August in the 1850 to 2026 record
All ten warmest Augusts on record have occurred since 2016, according to NOAA. The Northern Hemisphere summer, from June 1 to August 31, was its warmest on record, and the Southern Hemisphere had a near-record warm winter. The two baselines, pre-industrial and 20th century, are different reference points, so the 1.65 and 1.32 figures should not be compared directly.
What happened in September?
C3S reports that the global mean surface air temperature in September 2026 was 16.27 degrees Celsius, which is 1.63 degrees above the 1850 to 1900 pre-industrial level. That made it the second-warmest September, behind 2023. It was the second consecutive month above 1.5 degrees. Carlo Buontempo, director of C3S, said that we are in a new run of months above 1.5 degrees. According to a footnote in the bulletin, the previous two-month run ended in October and November 2025.
Why does a month above 1.5 degrees not mean the Paris goal has failed?
The Paris Agreement’s 1.5 degree goal refers to long-term warming, usually averaged over decades, and not to any single month. A month above the level shows how close the climate is running to it. This is a general point about how the goal is defined, and the reports we used do not argue it.
How warm were the oceans?
Sea surface temperature (SST) reached an all-time observed high in August. The highest daily global extra-polar ocean SST ever recorded was 21.11 degrees Celsius. In September, the average extra-polar SST of 21.05 degrees was the highest on record for the month, above the previous record of 20.92 degrees in 2023. Record SSTs spanned much of the tropical Pacific, where El Niño conditions are present. Around Europe, August SSTs hit record highs along the Atlantic coast and in the western Mediterranean, with widespread strong or severe marine heatwaves.
What about sea ice?
Arctic and Antarctic sea ice extent were each below average in August. In September, the Antarctic annual maximum of 18.19 million square kilometers on September 10 was the third lowest in the 48-year record. The Arctic annual minimum of 5.06 million square kilometers on September 13 was the 14th lowest in the satellite record.
What happened in Europe?
Western Europe had further heatwaves in August, continuing extreme heat that began in May, and then had its joint-warmest September, tied with 2023, after its hottest summer on record. Severe drought affected France, the UK, Hungary, Romania and Serbia, and exceptionally low river flows were recorded on the Rhine, Danube, Southern Bug and Dnieper. In September, record-low flows were recorded on parts of the Rhine, Danube, Vistula and Garonne-Dordogne rivers. Late-month rain brought partial relief but caused localized flooding in France and Spain. See our entry on drought for background.
What did tropical cyclones do?
In August there were 19 tropical storms worldwide, five of which reached hurricane or typhoon strength and four of which reached major status. The Atlantic was unusually quiet, with two weak, short-lived tropical storms, while the eastern North Pacific had eight named storms. The WMO says El Niño influenced tropical cyclones, heavy rain, floods and drought. Our article on the El Niño of 2026 explains the ocean pattern behind these shifts.
How does this fit the longer trend?
The WMO will present a climate update at COP31 in Antalya, Turkey, in November 2026. For the longer record, see our reports on CO2 emissions and climate change. A single hot month does not by itself show a trend, but the fact that all ten warmest Augusts fall since 2016 does.
Key figures at a glance
- August 2026: joint warmest month ever recorded (C3S), warmest August on record (NOAA)
- September 2026: 1.63 degrees Celsius above pre-industrial, second-warmest September
- Highest daily extra-polar sea surface temperature: 21.11 degrees Celsius
- Antarctic sea ice maximum: 18.19 million square kilometers, third lowest
- Arctic sea ice minimum: 5.06 million square kilometers, 14th lowest
Glossary: terms used here
- Anomaly: the difference between a measured temperature and a reference average
- Pre-industrial baseline: an estimate of average temperature for 1850 to 1900, used as the reference for the Paris Agreement
- ERA5: a global reanalysis dataset produced by the European Centre for Medium-Range Weather Forecasts that C3S uses for temperature figures
- Extra-polar sea surface temperature: the average ocean surface temperature between 60 degrees south and 60 degrees north
- Marine heatwave: a period of unusually high ocean temperature
The definitions above are general ones and are not quoted from the WMO or C3S pages.
Why do the datasets differ?
C3S, NOAA and NASA each process observations differently and use different baselines. The WMO says all of them show August 2026 at or near the top of the record. Our own reading is that the agreement on rank matters more than the exact decimal, since the methods are independent.
Frequently asked questions
Was August 2026 the hottest August?
Yes. NOAA ranks it the warmest August in its 1850 to 2026 record, and C3S ranks it joint warmest month ever, tied with July 2023.
How warm was September 2026?
1.63 degrees Celsius above pre-industrial, the second-warmest September behind 2023, according to C3S.
Is the cause El Niño?
The sources link the warmth to a developing El Niño alongside the long-term trend, without apportioning the two.