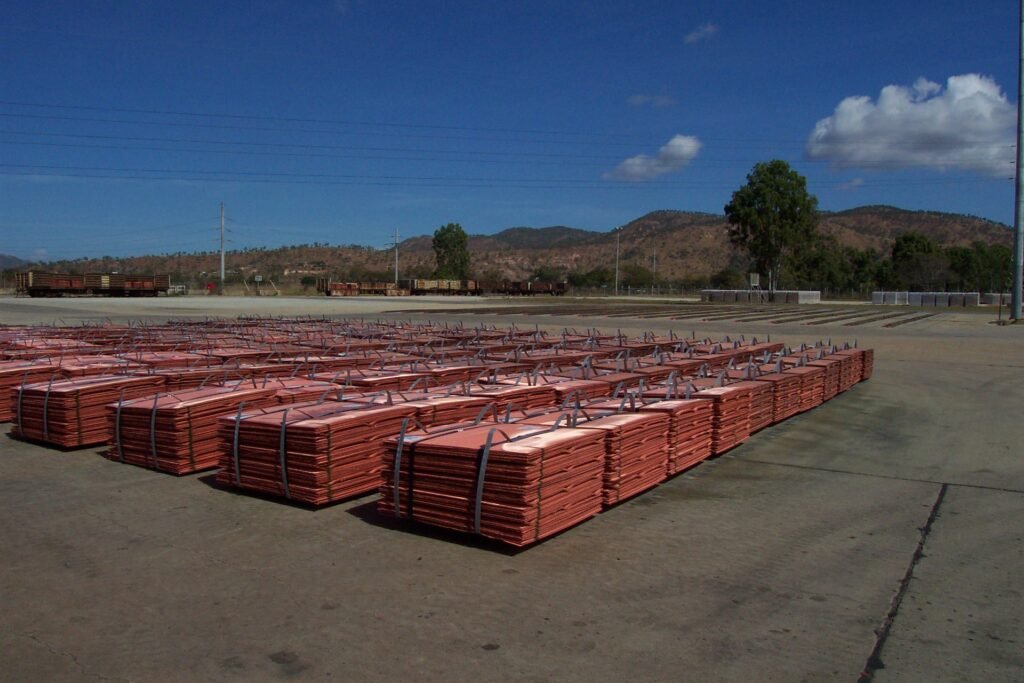
Copper is the metal that carries electricity through buildings, vehicles and power lines, and it was added to the United States list of critical minerals in November 2025. The U.S. Geological Survey (USGS) has now published its Mineral Commodity Summaries 2026 entry for copper. It reports record average prices in 2025, a sharp rise in U.S. net import reliance and a world mine output that stayed at about 23 million metric tons. This article summarizes the USGS figures.
How much copper does the United States mine and use?
USGS estimates 2025 U.S. mine production at about 1.0 million metric tons of copper content, down 5% from 2024, with a value of about $11 billion. Arizona produced about 70% of the total. The agency counts 26 mines, two primary smelters and several hundred foundries and other manufacturers. By end use, the Copper Development Association figures cited by USGS are building construction 42%, electrical and electronic products 23%, transportation equipment 18%, consumer and general products 10% and industrial machinery 7%.
Why did import reliance jump?
USGS puts net import reliance, meaning the share of apparent consumption met by net imports, at 57% in 2025, up from 45% in 2024. Imports of refined copper rose to an estimated 1.7 million metric tons from 903,000 tons a year earlier. By our own arithmetic, that is an increase of about 88%. Year-end refined stocks were estimated at 450,000 tons, compared with 123,000 tons at the end of 2024. USGS also reports that refined copper output fell an estimated 9% in 2025, owing to planned maintenance at both primary smelters, and that concentrator shutdowns and lower ore grades affected several mines. For 2021 to 2024, refined imports came from Chile (68%), Canada (16%), Peru (7%) and Mexico (6%). Our entries on Chile and Peru cover two of the main sources.
What happened to the price?
USGS projected that the COMEX copper price would average a record $4.80 per pound in 2025, 14% above $4.22 per pound in 2024. Analysts attributed the rise mainly to uncertainty about tariffs on U.S. copper imports, according to the agency. The U.S. producer cathode price averaged an estimated 490 cents per pound, and the London Metal Exchange cash price 440 cents per pound. These are estimates, and USGS marks them as such.
Who mines the world’s copper?
World mine production was about 23,000 thousand metric tons in both 2024 and 2025 (estimated). The largest producers in 2025 were:
- Chile: 5,300 thousand tons
- Congo (Kinshasa): 3,200 thousand tons
- Peru: 2,700 thousand tons
- China: 1,800 thousand tons
- Russia: 1,300 thousand tons
- United States: 1,000 thousand tons
Our entry on the Democratic Republic of the Congo covers the second-largest producer. Refining is more concentrated than mining. USGS estimates China’s 2025 refinery output at 14,000 thousand tons out of a world total of 29,000 thousand tons, which by our own arithmetic is about 48%.
How much is left in the ground?
USGS lists world reserves at 980,000 thousand tons, or 980 million tons. Chile holds the most at 180,000 thousand tons, followed by Australia at 100,000 thousand, Peru at 85,000 thousand, and Congo (Kinshasa) and Russia at 80,000 thousand each. The agency also reports identified resources of 1.5 billion tons as of 2015 and 3.5 billion tons of undiscovered resources. By our own arithmetic, dividing reserves by 2025 mine output gives about 43 years. That ratio is only a simple comparison and is not a forecast, because reserves change with prices and exploration.
Where does recycling fit?
USGS estimates that old, post-consumer scrap supplied about 160,000 tons of copper in 2025, and that about 760,000 tons were recovered from new scrap generated in manufacturing. Brass and wire-rod mills accounted for about 80% of copper recovered from scrap, and scrap contributed about 30% of the U.S. copper supply.
Why does demand matter for other technologies?
Copper wiring and windings sit inside electric motors, charging equipment and data center power systems. The USGS summary does not quantify demand from these uses, so we do not either. Our articles on the Global EV Outlook and on AI and data center electricity cover those sectors with figures from the International Energy Agency.
How to read the numbers
USGS reports copper in thousand metric tons of contained metal, so 1,000 in a table means one million tons. Figures marked with an e are estimates and may be revised in later editions. Mine production counts copper in ore, refinery production counts purified metal, and the two differ because ore is shipped between countries before it is refined. That is why China ranks fourth for mining but first for refining. Prices are quoted in cents per pound in the tables and in dollars per pound in the text, so 490 cents equals $4.90. The difference between the 440 cents London figure and the 490 cents U.S. producer figure reflects different markets and premiums, which USGS reports without explaining in detail.
Glossary
- Net import reliance: imports minus exports, expressed as a share of apparent consumption
- Refined copper: copper purified to a high grade, often as cathode sheets
- Reserves: the part of resources that can be economically extracted
- COMEX: the New York futures market whose copper price USGS cites
- Critical mineral: a material on a government list of resources judged important and vulnerable to supply disruption
The COMEX and critical mineral definitions are general explanations and are not quoted from USGS.
What are the substitutes?
USGS notes that aluminum can substitute for copper in car radiators, cooling and refrigeration tube, electrical equipment and power cable. Optical fiber can replace it in telecommunications, and plastics can replace it in drain pipe, plumbing fixtures and water pipe. Titanium and steel are used in heat exchangers.
Key facts at a glance
- U.S. mine output, 2025 estimate: about 1.0 million tons
- U.S. net import reliance: 57% in 2025, 45% in 2024
- Projected record COMEX average: $4.80 per pound
- World mine output: about 23 million tons
- World reserves: 980 million tons
Frequently asked questions
Which country mines the most copper?
Chile, at an estimated 5,300 thousand tons in 2025.
Is copper a critical mineral in the United States?
Yes. USGS says copper was added to the final 2025 list published on November 7, 2025.
Why did refined imports rise in 2025?
USGS gives lower U.S. refinery output and tariff uncertainty as part of the context. It does not assign a single cause.
Does recycling matter?
Yes. Scrap contributed about 30% of U.S. supply.