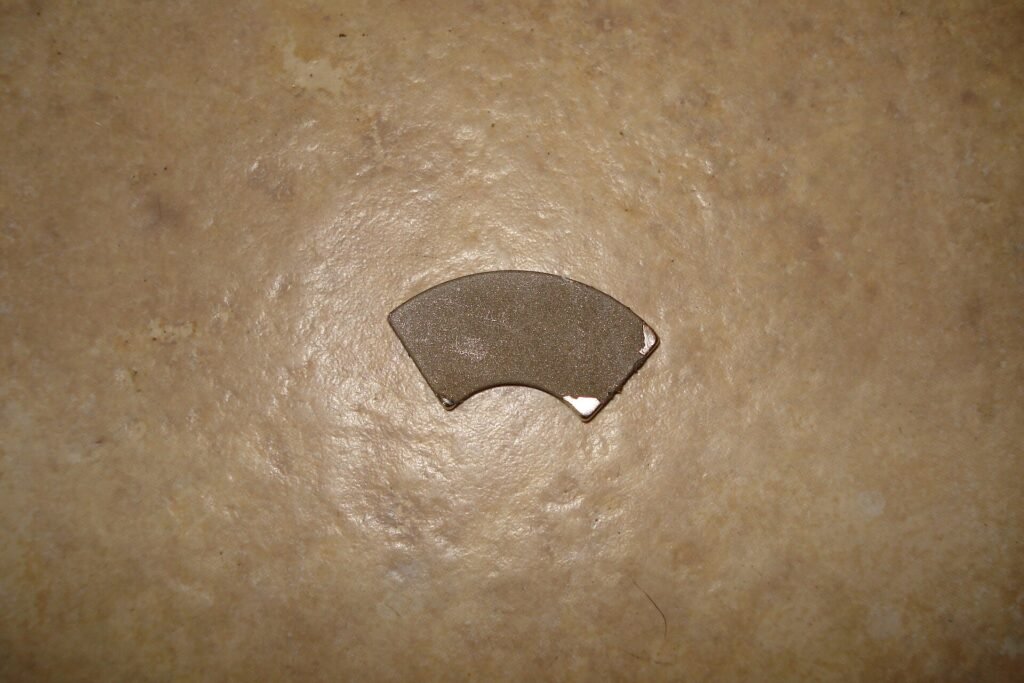
Rare earth elements sit inside the magnets of electric motors, wind turbines and many consumer devices, yet most people never see them. They have moved from a niche mining topic to a front-page one because production is concentrated in very few places and export rules have changed. The figures below come from the U.S. Geological Survey’s Mineral Commodity Summaries 2026.
What are rare earth elements?
Rare earth elements are a group of metals made up of the lanthanides plus yttrium and scandium. The USGS data include the lanthanides and yttrium but exclude most scandium. The name is misleading, because the elements are found widely in the Earth’s crust. What is scarce is mining and processing them at scale. Our encyclopedia entry on rare earth elements covers the chemistry in more detail.
What are rare earths used for?
According to the USGS, the leading global end use is magnets, while the leading end use in the United States is catalysts. Other uses include batteries, ceramics and glass, metallurgical applications and alloys, and polishing. Strong rare earth magnets matter for the motors in an electric vehicle and for the generators in a wind turbine, though the USGS summary itself does not list those two products by name.
Which countries mine the most rare earths?
The USGS estimates world mine production at 380,000 metric tons in 2024 and 390,000 metric tons in 2025, measured as rare earth oxide equivalent. The main producers are:
- China: 270,000 tons in 2024 and an estimated 270,000 in 2025
- United States: 45,500 tons in 2024 and an estimated 51,000 in 2025
- Australia: 29,000 tons in both years
- Burma: 27,000 tons in 2024 and an estimated 22,000 in 2025
- Thailand: 2,100 tons in 2024 and an estimated 4,800 in 2025
- Madagascar: 1,400 tons in 2024 and an estimated 2,700 in 2025
Smaller amounts came from India, Nigeria, Russia, Brazil, Vietnam and Malaysia. Canada, Greenland, South Africa and Tanzania reported no mine production.
How concentrated is production?
Using the USGS numbers, China accounted for roughly 71 percent of world mine production in 2024 and about 69 percent in 2025, and the United States for about 12 and 13 percent. These shares are our own arithmetic from the published tonnages, not figures the USGS prints. The picture shifts if processing is counted instead of mining, and the source consulted here covers mining only.
How dependent is the United States on imports?
The USGS reports U.S. net import reliance for rare earth compounds and metals as more than 95 percent in 2021 and 2022, more than 90 percent in 2023, 53 percent in 2024 and an estimated 67 percent in 2025. For mineral concentrates, the United States is a net exporter. Reliance can swing sharply from year to year, so a single year is a weak guide to the trend.
How much do rare earths cost?
Prices vary widely by element. The USGS lists 2025 average prices in dollars per kilogram, free on board:
- Lanthanum oxide: 1.00
- Cerium oxide: 1.71
- Samarium oxide: 2.82
- Europium oxide: 27
- Gadolinium oxide: 30
- Neodymium-praseodymium oxide: 69
- Neodymium oxide: 73
- Praseodymium oxide: 74
The magnet metals, neodymium and praseodymium, cost far more per kilogram than the light elements lanthanum and cerium.
Why do the price gaps matter?
A spread from about 1 dollar per kilogram for lanthanum oxide to 74 dollars for praseodymium oxide shows that rare earths are not one market but many. The USGS summary does not explain the reasons for the gaps, but the pattern points to very different demand and supply conditions for each element. For buyers, a shortage of one element can matter far more than a shortage of another, even though all of them appear under the same name.
What are the China export controls?
The USGS summarizes recent changes in policy. In April 2025, China tightened controls on alloys, compounds, metals and oxides of samarium, gadolinium, terbium, dysprosium, lutetium, scandium and yttrium. In October 2025 the controls were expanded to include europium, holmium, erbium, thulium and ytterbium. In November, China suspended the October export controls for one year. The April controls remained in effect, and China began issuing general export licenses to selected exporters. Rules like these can change quickly, so readers following the story should check the latest official announcements.
Key terms in the USGS tables
- Rare earth oxide equivalent: a standard way to compare output from different ores by converting it to oxide weight
- Net import reliance: imports minus exports, shown as a percentage of apparent consumption
- Mineral concentrates: partly processed ore, before the elements are separated
- Compounds and metals: the separated, refined products that manufacturers buy
How should readers follow export-control news?
Policy headlines often compress several steps into one line. In the USGS account, some controls were tightened, some were widened and then one set was suspended for a year while another stayed in force, and licenses were issued to selected exporters. A fair reading looks at which elements and which dates are covered, because suspension of one list does not mean the others have ended.
What do the numbers not show?
The USGS figures are estimates for 2025, and several countries are shown with data marked not available. Mine output also says little about who refines the material or makes the magnets, which is where much of the supply risk lies. Treat the shares above as a starting point for understanding the market, not a full map of the supply chain.
Frequently asked questions
Are rare earth elements actually rare?
They are found widely in the Earth’s crust. Economically minable deposits and the capacity to process them are what is limited.
Which country produces the most?
China, at 270,000 metric tons of rare earth oxide equivalent in both 2024 and 2025 according to the USGS.
What is the biggest use?
Magnets are the leading global end use, according to the USGS.
Is the United States a producer?
Yes. It was the second-largest producer in the USGS tables, at 45,500 tons in 2024 and an estimated 51,000 tons in 2025.