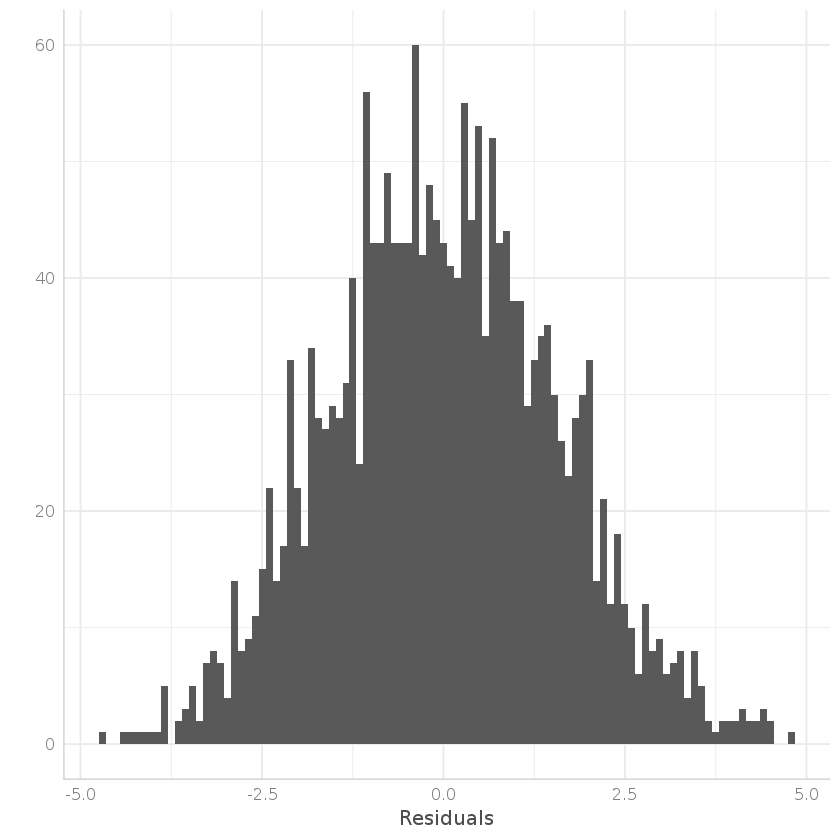
Data drift is a change over time in the distribution of the input data that a deployed machine learning model receives, compared with the data it was trained on. The model’s task and the meaning of the right answer stay the same, but the kinds of inputs shift. A model that predicts house prices after being trained on suburban listings will see its inputs drift if it begins receiving mostly downtown apartments. Data drift is also called covariate shift or feature drift [1], and it is one of the two main causes of model drift, the other being concept drift.
Definition and intuition
A model learns from examples drawn from a training distribution. It performs well on new inputs that look similar. When the production inputs come from a different distribution, the model faces cases it saw rarely or never, and its predictions become less reliable. In formal terms, the distribution of inputs P(X) changes, while the relationship P(Y given X) stays fixed [1]. If that relationship also changes, the problem is concept drift.
Common causes
- Changing populations. New customer segments, markets or demographics.
- Seasonality and trends. Holiday shopping, weather, fashion.
- Data collection changes. A new camera, sensor calibration, app version or form field.
- Pipeline changes. A unit conversion error, a renamed column, missing values or a delayed feed; see data pipeline.
- Sampling bias. Training data that never represented the real population in the first place.
- External events. Economic shocks, new regulations or disasters.
- Language change. New terms, topics and writing styles for text models.
- Feedback loops. The model’s recommendations change what users do, and so what data arrives.
Types of change in the data
- Covariate shift. The input distribution changes.
- Prior probability shift (label shift). The proportion of each class changes, such as more fraud during a holiday week.
- Missing or new categories. Values never seen in training appear.
- Schema drift. The structure or meaning of fields changes.
- Upstream drift. Changes in a data source or a model feeding another model.
Detecting data drift
Detection compares a reference window, usually the training data or a stable recent period, with a current window of production data.
### Statistical tests and distances
- Kolmogorov-Smirnov test for continuous features.
- Chi-squared test for categorical features.
- Population stability index (PSI), popular in credit risk, with common rules of thumb that values below 0.1 indicate little shift and above 0.25 a major shift [2].
- Jensen-Shannon and Kullback-Leibler divergence, and Wasserstein distance, which measure how far apart two distributions are.
- Summary statistics. Changes in mean, variance, quantiles, missing rate and cardinality.
### Multivariate and model-based methods
Features can shift jointly without any single one changing much. A domain classifier trained to tell training data from production data signals drift when it succeeds, and its most important features show where the shift is. Embedding-based methods apply distances to learned representations, useful for images and text.
### Practical monitoring
Teams monitor each important feature, the model’s prediction distribution and its confidence, and alert when scores cross thresholds. Because many features and many tests produce false alarms, alerts should be prioritized by feature importance and by effect on predictions. See AI observability.
Does drift always matter?
No. Inputs can shift in ways that do not affect predictions, for example when a rarely used feature changes. Conversely, a model can fail with no obvious input shift if concept drift occurs. Good practice pairs input monitoring with performance tracking on labeled data when it becomes available [1][2].
Responding to data drift
- Check data quality first. Many apparent drifts are pipeline bugs.
- Assess impact. Measure effect on predictions and accuracy, by segment.
- Retrain on recent data or a mix of old and new, validating on current data.
- Reweight training examples to match the new input distribution, a technique called importance weighting.
- Adapt or fine-tune the model; see transfer learning.
- Expand data coverage by collecting examples of new conditions, and use data augmentation.
- Use robust features that stay stable across conditions; see model robustness.
- Fall back to rules or human review for inputs flagged as out of distribution; see human-in-the-loop AI.
Tools
Open-source and commercial tools such as Evidently, WhyLabs, Arize, Fiddler and cloud monitoring services compute drift metrics and dashboards. Many teams also build custom checks into their data pipeline or LLMOps setup.
Data drift and language models
For language models, prompts and documents change over time as users discover new uses, topics trend, and retrieved content is updated. Monitoring embeddings of incoming prompts, topic mixes, lengths and refusal rates can reveal drift, and evaluation sets should be refreshed with recent real examples; see AI evaluation.
A worked example with PSI
The population stability index compares the share of data in each bucket between a reference and a current sample. Suppose a lender buckets applicant income into five ranges. In the training data the shares are 10, 20, 40, 20 and 10 percent. In the latest month they are 25, 25, 30, 15 and 5 percent, reflecting a wave of lower-income applicants. For each bucket, the index adds the difference in shares multiplied by the natural log of their ratio. Summing the five terms gives a PSI of about 0.3, above the common 0.25 warning level. The team does not retrain at once. First they confirm that income is recorded correctly, then they check that approval rates and default rates by income band are behaving as expected. They find that the model’s scores for the new group are less well calibrated, so they collect more data on that group, retrain with a larger weight on recent applicants and set up weekly PSI checks on the five most influential features.
Windows and baselines
Choosing the reference and current windows shapes what drift detection reports. A fixed reference, such as the training set, measures cumulative departure from the original conditions and will eventually always show drift. A rolling reference, such as the previous month, measures recent change but can miss slow creep, since each step is small. Many teams track both. The current window must be large enough to give stable statistics, yet short enough to catch problems quickly, which is a trade-off set by data volume and how costly delays are. Seasonal patterns should be handled by comparing the same period in earlier years, so that a normal December spike is not flagged as drift.
Out-of-distribution inputs
Data drift is a gradual, population-level change. A related issue is individual inputs that are simply unlike anything in training, called out-of-distribution or anomalous inputs. Systems can flag these using distance in embedding space, density estimates or model uncertainty, and route them to a safe default or a person. Detecting both kinds of unfamiliarity makes a deployment safer; see model robustness.
FAQs
What is data drift? It is a change in the distribution of the input data a model receives after deployment, compared with its training data.
What is the difference between data drift and concept drift? Data drift changes the inputs. Concept drift changes the relationship between inputs and the correct output.
How is data drift detected? By comparing production data with a reference using statistical tests such as KS and PSI, or a classifier that distinguishes the two.
Does data drift always reduce accuracy? No. It matters only if it affects the model’s predictions.
How do you fix data drift? Check data quality, then retrain, reweight, expand data coverage or add fallbacks.
More in AI Evaluation and Reliability
Key facts
- Data drift, also called covariate shift, is a change in the distribution of input features between training and production while the relationship between inputs and outputs stays the same1.
- The population stability index and the Kolmogorov-Smirnov test are widely used to measure whether a feature's distribution has shifted2.
- Not every drift hurts: a shift in inputs only matters if it affects the model's predictions or accuracy1.
Related concepts
Quick checkWhat is data drift?Show answer
Data drift is a change over time in the statistical distribution of the input data a deployed machine learning model receives, compared with its training data, which can reduce accuracy even when the underlying task has not changed.
Sources
- Joaquin Quinonero-Candela et al., Dataset Shift in Machine Learning, MIT Press, https://mitpress.mit.edu/9780262170055/dataset-shift-in-machine-learning/
- Joao Gama et al., A Survey on Concept Drift Adaptation, ACM Computing Surveys, https://doi.org/10.1145/2523813
Editorially reviewed by Specialty Digest Editorial TeamLast reviewed November 17, 2026Researched and drafted with AI assistanceReport an issue