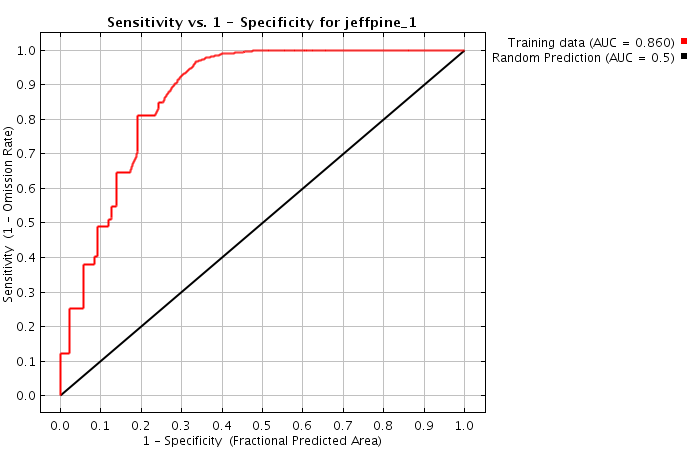
Model evaluation is the process of measuring how well a machine learning model performs, to decide whether it is good enough for its purpose and how it compares with other models. A model that looks impressive during development may disappoint in real use, so careful evaluation is the bridge between research results and trustworthy products. It involves choosing data to test on, selecting metrics that match the real goal, comparing against baselines, and looking beyond averages to find where the model fails.
Principles
### Evaluate on unseen data
A model that is tested on the examples it learned from will look better than it is, because it can memorize them. The standard remedy is to measure performance on held-out data: validation data for choosing settings and testing data for the final check [1]. When data is limited, cross-validation repeats the process over several splits.
### Match the metric to the goal
No single number fits every task. A medical screening tool should rarely miss disease, a spam filter should seldom block real mail, and a recommender should surface items people like. Metrics must reflect what mistakes cost.
### Compare with baselines
A result means little without a reference. Baselines include a trivial rule, such as always predicting the most common class, a simple model such as logistic regression, the current production system and human performance. Improvement over a strong baseline is what counts.
Metrics for classification
Classification models predict categories. Their results are summarized in a confusion matrix, counting true and false positives and negatives.
- Accuracy. The share of predictions that are correct. Misleading when classes are imbalanced [2].
- Precision. Of the items predicted positive, the share that really are positive.
- Recall. Of the truly positive items, the share found. Also called sensitivity.
- F1 score. The harmonic mean of precision and recall.
- ROC curve and AUC. Plot the true positive rate against the false positive rate across thresholds, with the area under the curve summarizing ranking quality.
- Precision-recall curve. More informative than ROC when positives are rare.
- Log loss and calibration. Measure whether predicted probabilities are accurate, so that a stated 80 percent chance really happens about 80 percent of the time.
Metrics for other tasks
- Regression. Mean absolute error, mean squared error, root mean squared error and R-squared.
- Ranking and recommendation. Normalized discounted cumulative gain, mean reciprocal rank and precision at k.
- Object detection and segmentation. Intersection over union and mean average precision; see object detection.
- Machine translation and summarization. BLEU, ROUGE and learned metrics, supported by human review; see natural language processing.
- Language modeling. Perplexity.
- Clustering. Silhouette score and adjusted Rand index.
- Generative models. Fidelity and diversity measures for images, and rubric-based or model-based judging for text; see AI evaluation.
Beyond a single score
- Slice analysis. Check performance by subgroup, language, device or condition. An average can hide a failure on a small group; see algorithmic bias.
- Error analysis. Read a sample of mistakes to find patterns, such as label errors or missing cases.
- Robustness. Test with noise, typos, unusual inputs and adversarial examples; see model robustness.
- Generalization. Compare training and test scores to detect overfitting or underfitting; see generalization.
- Uncertainty. Report confidence intervals, since small test sets give noisy estimates.
- Efficiency. Latency, memory and cost matter for deployment.
- Interpretability. Can the reasoning be understood? See model interpretability.
Offline and online evaluation
Offline evaluation uses saved data and is cheap and repeatable. Online evaluation observes real users, for instance through an A/B test comparing two models on business outcomes such as clicks or resolved tickets. Good offline scores do not guarantee online gains, so both are used. After release, monitoring detects data drift and model drift.
Common pitfalls
- Data leakage. Information from test data influencing training.
- Tuning on the test set. Repeated peeking makes scores optimistic.
- Unrepresentative test data. Not matching the real world.
- Wrong metric. Optimizing a number that does not match the goal.
- Ignoring base rates. A test with 95 percent accuracy can still produce mostly false alarms when the condition is rare.
- Small samples. Overinterpreting small differences.
- Benchmark contamination. Test items appearing in a model’s training text.
Evaluating modern AI systems
For large language models and agents, evaluation combines public benchmarks, custom task tests, human preference ratings, safety testing and live monitoring. See AI benchmark and red teaming.
A worked example
Suppose a hospital develops a model to flag chest X-rays that may show pneumonia. Of 10,000 test images, 500 truly show it. The model flags 600 images, and 450 of those are correct. Accuracy looks high, since the model is right on most images simply because most are normal, so the team looks deeper. Recall is 450 of 500, or 90 percent, meaning one case in ten is missed. Precision is 450 of 600, or 75 percent, meaning one flagged image in four is a false alarm. The team asks doctors which error is worse. Missing a case is more harmful than a false alarm, so they lower the decision threshold to raise recall, accept more false alarms and check how the workload for radiologists changes. They then review results by hospital site, age group and scanner type, and find recall is lower on images from one older scanner. That finding leads to targeted data collection before launch.
Statistical care
Test scores are estimates, not facts. With a few hundred test examples, a difference of one or two points between models may be noise. Good practice includes confidence intervals, repeated runs with different random seeds, paired tests on the same examples and clear reporting of the data and settings. Researchers also guard against the multiple comparisons problem: if many models or settings are tried, one will look best by chance. Fresh, untouched test data or a pre-registered evaluation plan reduces this risk.
Evaluation as an ongoing process
Evaluation does not end at launch. Real-world inputs change, user behavior shifts and expectations rise. Mature teams keep a living evaluation suite, add new cases from production failures, rerun it for every change to the model, prompt or data, and track results over time on a dashboard. They define release criteria in advance, such as minimum recall and maximum latency, and require sign-off from domain experts and risk reviewers for sensitive applications. See AI governance and AI observability.
FAQs
What is model evaluation? It is measuring how well a machine learning model performs on unseen data using suitable metrics.
Why not evaluate on training data? Because the model may have memorized it, giving an over-optimistic picture of real performance.
Which metric is best? It depends on the task and the cost of different errors. Precision, recall and F1 suit classification, while error measures suit regression.
What is cross-validation? A method that rotates which part of the data is held out to give a more reliable estimate.
What is a baseline? A simple reference model or rule used to judge whether a new model is a real improvement.
More in AI Evaluation and Reliability
Key facts
- Evaluating a model on the same data used to train it gives an overly optimistic estimate, so performance is measured on held-out data1.
- Different metrics suit different problems: accuracy, precision, recall and F1 for classification, and measures such as mean squared error for regression1.
- Accuracy can be misleading on imbalanced data, where a model that always predicts the majority class scores high but is useless2.
Related concepts
Quick checkWhat is model evaluation?Show answer
Model evaluation is the process of measuring how well a machine learning model performs, using data it has not seen and metrics suited to the task, to judge whether it is good enough to use and how it compares with alternatives.
Sources
- Trevor Hastie, Robert Tibshirani and Jerome Friedman, The Elements of Statistical Learning, Springer, https://hastie.su.domains/ElemStatLearn/
- Haibo He and Edwardo Garcia, Learning from Imbalanced Data, IEEE Transactions on Knowledge and Data Engineering, https://doi.org/10.1109/TKDE.2008.239
Editorially reviewed by Specialty Digest Editorial TeamLast reviewed November 17, 2026Researched and drafted with AI assistanceReport an issue