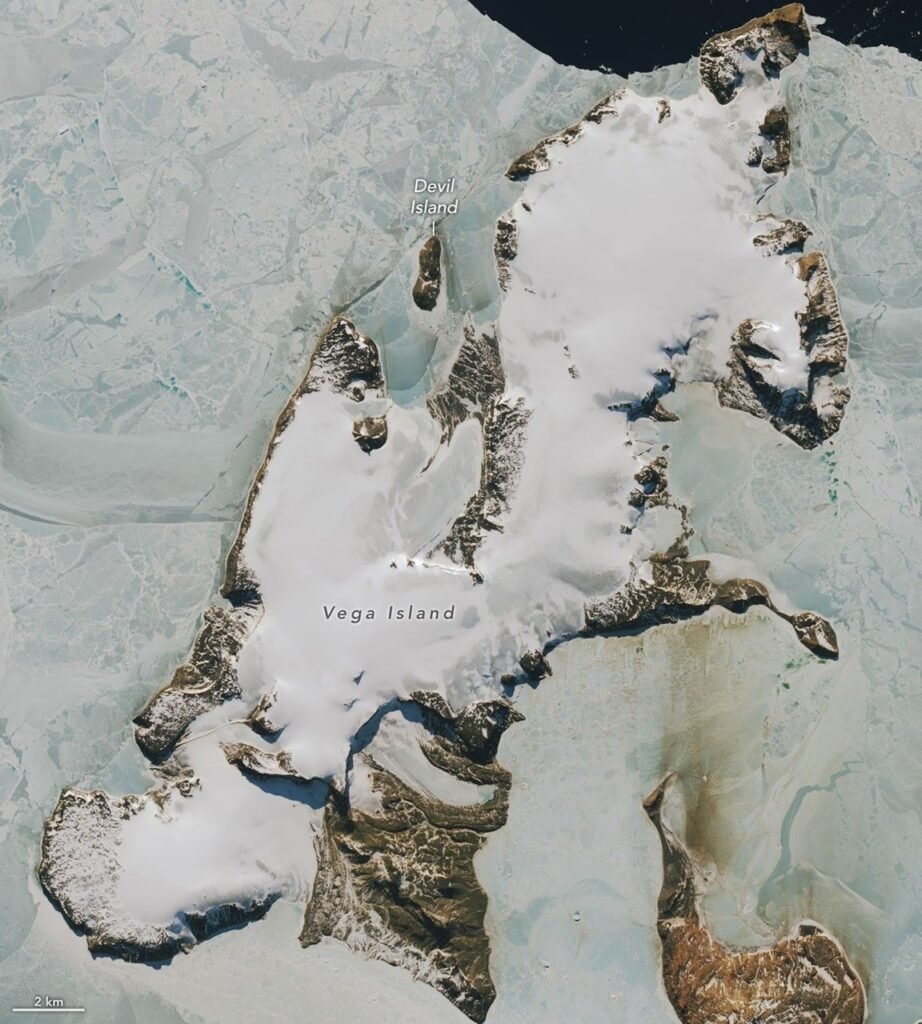
A NASA Earth Observatory image published on October 30, 2026 shows Vega Island, a small island in the Weddell Sea off the Antarctic Peninsula whose ice and rock resemble a skull. The image combines Landsat 9 observations from March 22, 2025 and October 10, 2026. NASA also reports that above-average winter temperatures in 2026 exposed bare ice on the island. This article summarizes the Earth Observatory report, explains the terms and flags what the image does not show.
Why does Vega Island look like a skull?
NASA describes the features that create the look. A nunatak, which is a rock peak that sticks out through ice, forms the eye socket. A lateral moraine, a ridge of rock debris carried along the side of a glacier, forms the mouth. The Devil’s Bay Glacier forms the jaw. The resemblance is a matter of how the shapes appear from orbit and has no scientific meaning of its own.
What do we know about the glaciers?
NASA says a 1982 study found four ice caps and 29 glaciers on the island. The Devil’s Bay Glacier has been monitored since 1998 and 1999, and the report says it has lost mass overall. By our own arithmetic, that is about 27 years of monitoring by 2026. NASA does not give a mass figure in the part we read.
What happened in 2026?
The report says above-average winter temperatures in 2026, particularly in June, exposed bare ice by October. Mauri Pelto, a glaciologist quoted by NASA, said: “The winter season was no treat for these glaciers.” Bare ice is darker than snow and absorbs more sunlight, which is a general point that is ours and not from the report. Our articles on glacier loss in 2025 and Antarctic sea ice in 2026 cover wider changes in the region.
How do satellites show this?
The images come from the Operational Land Imager on Landsat 9. Comparing a March 2025 view with an October 2026 view shows how the surface changed between two dates. This is a general description of the method. For related reading on what melting ice means for oceans, see sea level rise and the report on tipping points.
Why compare images from two dates?
A single image shows how a place looks at one moment. A pair taken at similar times of the year helps a reader separate lasting change from seasonal change. The March 2025 and October 2026 images fall in different seasons, so differences between them can reflect the season as well as longer-term change. That caution is ours and is not stated in the NASA report. The report instead links the October 2026 appearance to the warm winter, particularly in June, and to the bare ice it exposed.
How should the monitoring record be read?
A monitoring record that starts in 1998 and 1999 gives roughly a quarter century of observations of one glacier. NASA says the glacier lost mass overall across that time, which is a statement about the long-run direction and not about every year. The 1982 count of four ice caps and 29 glaciers is a different kind of record, a survey of how many ice bodies the island held at that time. The two records answer different questions, and the report does not say whether the number of glaciers has changed since 1982.
What does this say about Antarctica as a whole?
The Antarctic Peninsula region, where the island lies, has a different climate from the continental interior. A warm winter there does not by itself tell us about the vast ice sheets inland. This is a general geographic point and is not from the report. Readers who want wider context can follow the links above to our coverage of the region and of glaciers worldwide, which draw on other sources and larger data sets.
How to read the image
The pair of images compares two dates a year and a half apart, so it can show surface appearance but not the mass of ice lost. A darker surface in October 2026 could reflect exposed bare ice, but the report does not give a measurement of how much snow melted. The island is small, so it should not be read as a measure for all of Antarctica.
What is the history of the island?
The report includes the Swedish Antarctic Expedition of 1901 to 1903 in its history of the area. We read only the summary of that history and do not add details from other sources.
What should readers watch for next?
The ongoing monitoring of the Devil’s Bay Glacier will show whether the 2026 loss is a one-year event or part of a longer decline. The NASA report does not forecast.
Related reading: Pennsylvania's Grand Canyon: NASA Landsat Shows Autumn Color in Pine Creek Gorge.
Related reading: Bismarck Sea Submarine Eruption: Satellites Track Plumes and Pumice in May 2026.
Glossary
- Nunatak: a rock peak that projects through an ice sheet or glacier
- Lateral moraine: a ridge of debris along the side of a glacier
- Ice cap: a dome-shaped ice mass covering a small area
- Landsat 9: a joint NASA and USGS Earth observation satellite
- Bare ice: glacier ice not covered by snow
These definitions are general explanations and are not quoted from NASA.
What is not covered here?
We read the NASA Earth Observatory article only. We did not read the 1982 study or any monitoring data.
Key facts at a glance
- Place: Vega Island, Weddell Sea
- Image dates: March 22, 2025 and October 10, 2026
- 1982 count: 4 ice caps and 29 glaciers
- Devil’s Bay Glacier: monitored since 1998 and 1999; lost mass overall
Frequently asked questions
Why is it called a skull?
Rock and ice shapes form what looks like an eye socket, mouth and jaw.
Did the island lose ice in 2026?
NASA reports that warm winter weather exposed bare ice, but it gives no mass figure.
Which satellite took the images?
Landsat 9.
More in Nature