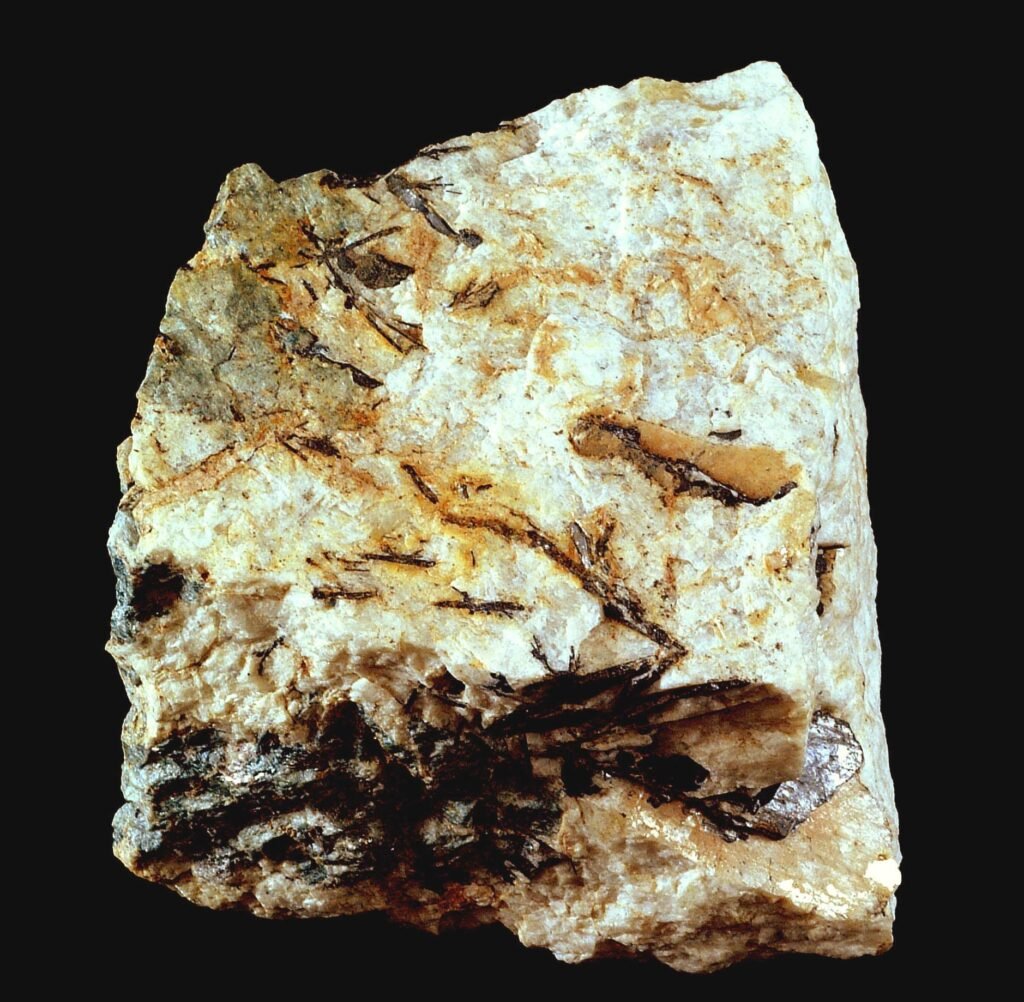
Tantalum in 2025 was mined at an estimated 2,500 metric tons worldwide, unchanged from 2024, according to the U.S. Geological Survey’s Mineral Commodity Summaries 2026. Congo (Kinshasa), Rwanda and Nigeria supplied most of it. The United States mines no tantalum, and its apparent consumption jumped an estimated 58%. This article summarizes the USGS tantalum chapter, explains the main numbers and flags what the chapter does not say.
Who mines tantalum?
The USGS lists estimated 2025 mine production, in metric tons of tantalum content:
- Congo (Kinshasa): 1,300
- Rwanda: 400
- Nigeria: 390
- Brazil: 190
- China: 80
- Australia: 50
- Ethiopia: 40
- Russia: 30
By our own arithmetic, Congo (Kinshasa) mines about 52% of the world total, and Congo, Rwanda and Nigeria together mine about 84%. The USGS rounds the world total. Several 2024 values for Brazil and Mozambique carried merged footnote marks in the copy we read, so we compare no 2024 figures for them.
How much tantalum is left?
The USGS does not give a world reserve total, and most country reserve lines are marked not available. The Australian line was garbled in the copy we read. The chapter says identified world resources are mostly in Australia, Brazil, Canada and China and are adequate. It puts identified U.S. resources at about 55,000 tons, mostly not economic at 2025 prices.
What is tantalum used for?
The copy of the chapter we read gives no end-use percentages. It lists substitutes and notes that recycling may account for as much as 30% of consumption by domestic primary processors. Our report on niobium in 2025 covers the sister metal that often occurs in the same ores.
How dependent is the United States on imports?
Net import reliance is 100% in every year from 2021 to 2025. Imports rose from 1,070 tons in 2024 to an estimated 1,300, up 22%. Exports fell from 506 tons to 420, down 17%. The USGS puts the import value of tantalum consumed at $190 million, says the value of waste and scrap imports rose 40%, and says the value of primary metal fell 20%. The tantalite ore price averaged $180 per kilogram of tantalum pentoxide, against $167 in 2024.
Why did consumption jump?
Apparent consumption rose from 566 tons in 2024 to an estimated 890 in 2025, which the chapter calls a 58% increase. By our own arithmetic the table gives about 57%, a gap that reflects rounding. The 2023 table entry was garbled, so we do not use it. With no U.S. mine, apparent consumption is imports minus exports plus stock changes, so a sharp rise in imports and a fall in exports produce it directly. The chapter does not say what drove demand.
Where do imports come from?
For 2021 to 2024, total imports came from China (22%), Australia (14%), Germany (11%) and Indonesia (7%), with other countries at 46%. Ores and concentrates came from Australia (64%), Mozambique (10%), Congo (Kinshasa) (9%) and the United Arab Emirates (5%). Metal and powder came from China (47%), Germany (25%) and Kazakhstan (16%). Waste and scrap came from Indonesia (18%), South Korea (18%), Japan (12%) and China (8%). The mine countries and the import countries differ, because processing happens elsewhere.
What events does the chapter note?
In June 2025, Congo (Kinshasa) and Rwanda signed a peace agreement, mediated by the United States and observed by Qatar. In September 2025, the Defense Logistics Agency placed an $8.6 million delivery order for tantalum ingots from a Pennsylvania company, for the National Defense Stockpile. The same company has a separate five-year contract worth up to $100 million. The chapter reports these as events and does not estimate their effect on supply.
What tariffs apply?
As of December 31, 2025, tantalum ores and concentrates, niobium ores, synthetic concentrates and waste and scrap entered duty free. Tantalum oxide faced 3.7%, potassium fluorotantalate 3.1%, unwrought powders and metal 2.5% and wrought tantalum 4.4%. The depletion allowance is 22% for domestic and 14% for foreign production.
What does the longer record show?
Imports were 1,330 tons in 2021, peaked at 1,720 in 2022, then fell to 1,110 in 2023 and 1,070 in 2024 before the 2025 rebound to about 1,300. Exports hovered between 655 and 672 tons from 2021 to 2023 and then slid to 420. The ore price rose from $158 per kilogram in 2021 to $196 in 2022, eased to $167 in 2024 and reached $180, so the 2025 price is about 14% above 2021 by our own arithmetic. Demand swings far more than price does here.
How to read the numbers
Tonnages are tantalum content, while ore prices are quoted per kilogram of tantalum pentoxide. Government stockpile entries use different units and are hard to compare. Estimates for 2025 are first reads that the USGS may revise.
How does tantalum connect to other coverage?
Tantalum is traded with other minor metals. See our reports on cobalt in 2025, tungsten in 2025 and the USGS summary of U.S. mineral production.
What should readers watch for next?
Readers can watch Central African output, stockpile purchases and the next USGS edition, which replaces estimates with reported data.
Glossary
- Tantalite: the main tantalum ore mineral
- Tantalum pentoxide: the oxide form used to price ore
- Ingot: a cast block of metal
- Net import reliance: imports minus exports, as a share of apparent consumption
- Stockpile: a reserve of materials held by a government
These definitions are general explanations and are not quoted from the USGS.
What is not covered here?
We omit the Australian reserve line, the 2023 table entry, the stockpile quantities and any price forecast.
Key facts at a glance
- World mine production, 2025: about 2,500 tons
- Congo (Kinshasa): 1,300 tons, about 52%
- U.S. net import reliance: 100%
- U.S. apparent consumption: up about 58%
- Ore price: about $180 per kilogram of tantalum pentoxide
Frequently asked questions
Which country mines the most tantalum?
Congo (Kinshasa), at an estimated 1,300 tons in 2025.
Does the United States mine tantalum?
No. The USGS shows no mine output and 100% import reliance.
How much tantalum is recycled?
The USGS says recycling may supply up to 30% of consumption by domestic primary processors.
More in Business
- Chromium in 2025: USGS Shows South Africa Mines 45 Percent of World Chromite
- Gallium in 2025: USGS Shows U.S. Metal Imports More Than Double as China Holds 99 Percent
- Germanium in 2025: USGS Shows U.S. Metal Imports Fall 67 Percent as Prices Double
- Soda Ash in 2025: USGS Shows the U.S. Exports More Than Half of Its Output