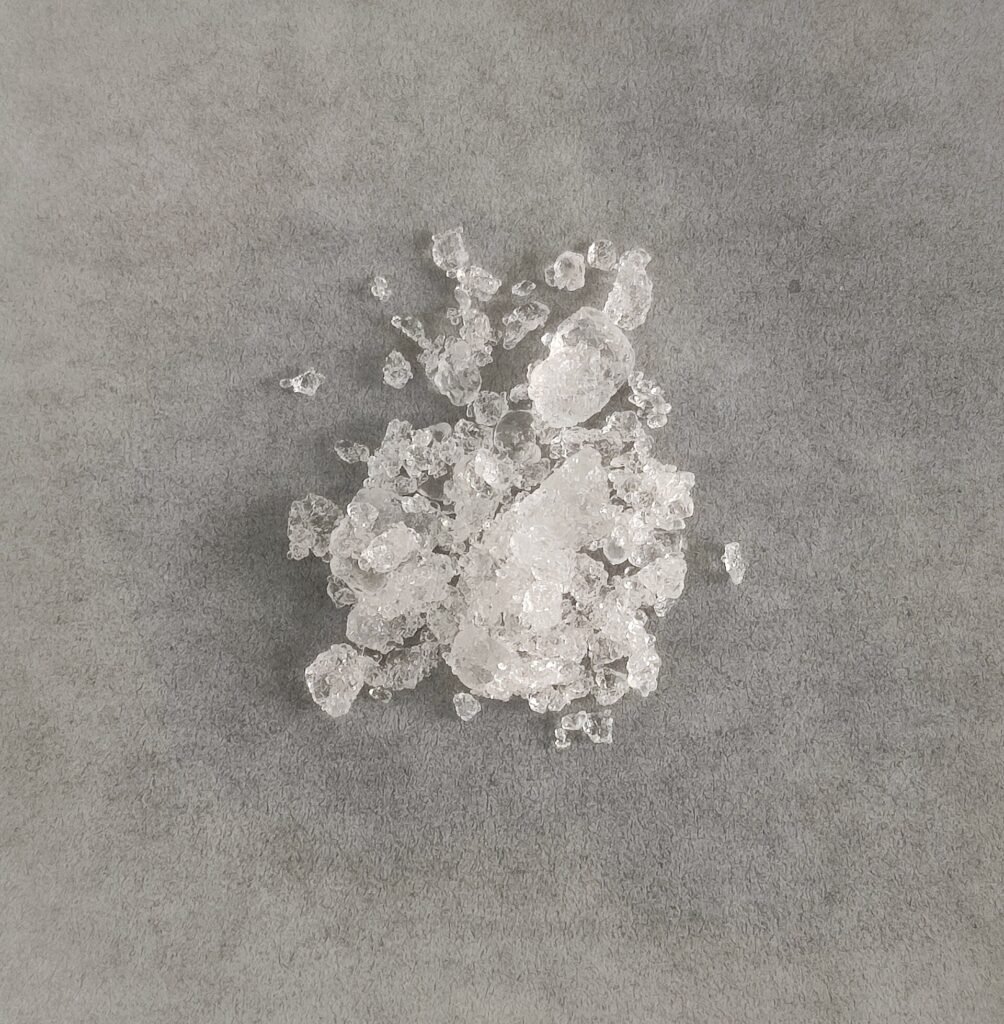
Gallium in 2025 was supplied mostly by China, which the U.S. Geological Survey says accounted for 99% of world primary low-purity production, according to its Mineral Commodity Summaries 2026. The United States produces no primary gallium. Its imports of gallium metal more than doubled in 2025. This article summarizes the USGS gallium chapter, explains the main numbers and flags what the chapter does not say.
Who produces gallium?
The USGS says China accounted for 99% of worldwide primary low-purity gallium production. Japan and Russia also produce it, at estimated 3,000 and 6,000 kilograms in 2025. Other countries stopped primary production: Kazakhstan in 2013, Hungary in 2015, Germany in 2016 and, most likely, Ukraine in 2022. The table of world production had merged footnote marks and totals that did not match their components in the copy we read, so we do not print Chinese output or capacity figures.
What is gallium used for?
The USGS gives U.S. uses: integrated circuits, 73% of domestic consumption, and optoelectronic devices such as light-emitting diodes and laser diodes, 26%. Gallium arsenide wafers carry much of that demand. Our reports on bauxite and alumina in 2025 and zinc in 2025 cover the two ore types in which the USGS notes gallium.
Where does gallium come from in the ground?
The USGS puts the average gallium content of bauxite at about 50 parts per million, and says gallium in world bauxite resources exceeds 1 million tons. Some domestic zinc ores contain up to 50 parts per million. The chapter gives no reserves. Gallium is therefore plentiful in principle but costly to recover in practice, because it is so dilute.
How dependent is the United States on imports?
Net import reliance is 100% in every year from 2021 to 2025. Imports of gallium metal were an estimated 25,000 kilograms in 2025, against 11,000 in 2024, which is more than double. Imports of gallium arsenide wafers fell from 152,000 kilograms to 110,000. The chapter calls that 24% lower, while the table figures give about 28%, a gap we flag and do not resolve. Reported consumption was 19,000 kilograms, near 18,700 in 2024. The metal import value was about $15 million and the wafer import value about $120 million.
Where do imports come from?
For 2021 to 2024, metal imports came from Canada (28%), Japan (22%), China (18%) and Germany (16%), with other countries at 16%. China was therefore a minor direct source of U.S. metal even though it dominates world production. The chapter does not explain how Chinese output reaches other exporters.
How did the price move?
The average unit value of imported metal was about $580 per kilogram in 2025, roughly 30% above the 2024 value of $439, and about 2.1 times the 2021 value of $277 by our own arithmetic. Yearend consumer stocks were 3,400 kilograms, almost level with 3,410 a year earlier.
What export controls does the chapter describe?
The USGS says Chinese gallium export controls began in August 2023, that a ban on exports to the United States began in December 2024 and that the ban was lifted in November 2025 for one year. The chapter reports these dates as facts and does not forecast what happens when the year ends. Readers should treat the lifting as temporary on its own terms.
What U.S. projects does the chapter mention?
In September 2025, the Department of Energy announced up to $6 million in research and development funding. In November 2025, a $29.9 million Defense Production Act Title III award went to a demonstration facility in Louisiana. The chapter lists these as awards and does not report output.
What does the five-year record show?
Imports of gallium metal were 8,890 kilograms in 2021, then 11,400 in 2022 and 2023, 11,000 in 2024 and an estimated 25,000 in 2025, about 2.8 times the 2021 level by our own arithmetic. Imports of gallium arsenide wafers moved the other way, from 306,000 kilograms in 2021 to a peak of 424,000 in 2022 and then down to 110,000, about 64% below 2021. Reported consumption barely changed, at 17,100, 19,700, 17,800, 18,700 and 19,000 kilograms. Metal imports rose far faster than use, which suggests stocks or a change in the form of imports, though the chapter does not say. The pattern is a reminder that a single year of imports can mislead, and that wafers and metal are different routes into the same supply chain. Readers should look at several years together before drawing a conclusion about demand.
How to read the numbers
Metal is counted in kilograms of gallium, while wafers are counted in gross weight. Those bases differ. Estimates for 2025 are first reads that the USGS may revise.
How does gallium connect to other coverage?
Gallium belongs to the critical minerals family. See our reports on aluminum in 2025, rare earth elements and the USGS summary of U.S. mineral production.
What should readers watch for next?
Readers can watch the end of the one-year export pause, the Louisiana facility and the next USGS edition, which replaces estimates with reported data.
Related reading: Germanium in 2025: USGS Shows U.S. Metal Imports Fall 67 Percent as Prices Double.
Glossary
- Gallium arsenide: a compound semiconductor made from gallium and arsenic
- Byproduct: a material recovered while processing another ore
- Optoelectronic device: a device that makes or senses light, such as a diode
- Net import reliance: imports minus exports, as a share of consumption
- Parts per million: a measure of a very small share
These definitions are general explanations and are not quoted from the USGS.
What is not covered here?
We omit Chinese output and capacity figures, because the table was garbled, and any price forecast.
Key facts at a glance
- China share of primary low-purity output: 99%
- U.S. metal imports: about 25,000 kilograms, more than double
- Integrated circuits: 73% of U.S. use
- Import price: about $580 a kilogram
- U.S. net import reliance: 100%
Frequently asked questions
Which country produces the most gallium?
China, at 99% of primary low-purity production according to the USGS.
What is gallium used for?
Mostly integrated circuits and light-emitting devices.
Does the United States produce gallium?
No. The USGS shows no primary production and 100% import reliance.
More in Business
- Germanium in 2025: USGS Shows U.S. Metal Imports Fall 67 Percent as Prices Double
- Soda Ash in 2025: USGS Shows the U.S. Exports More Than Half of Its Output
- Sulfur in 2025: USGS Shows the Average Price Nearly Quadrupling to $180 a Ton
- Boron in 2025: USGS Shows Turkey Holds 87 Percent of Listed Reserves as Projects Advance