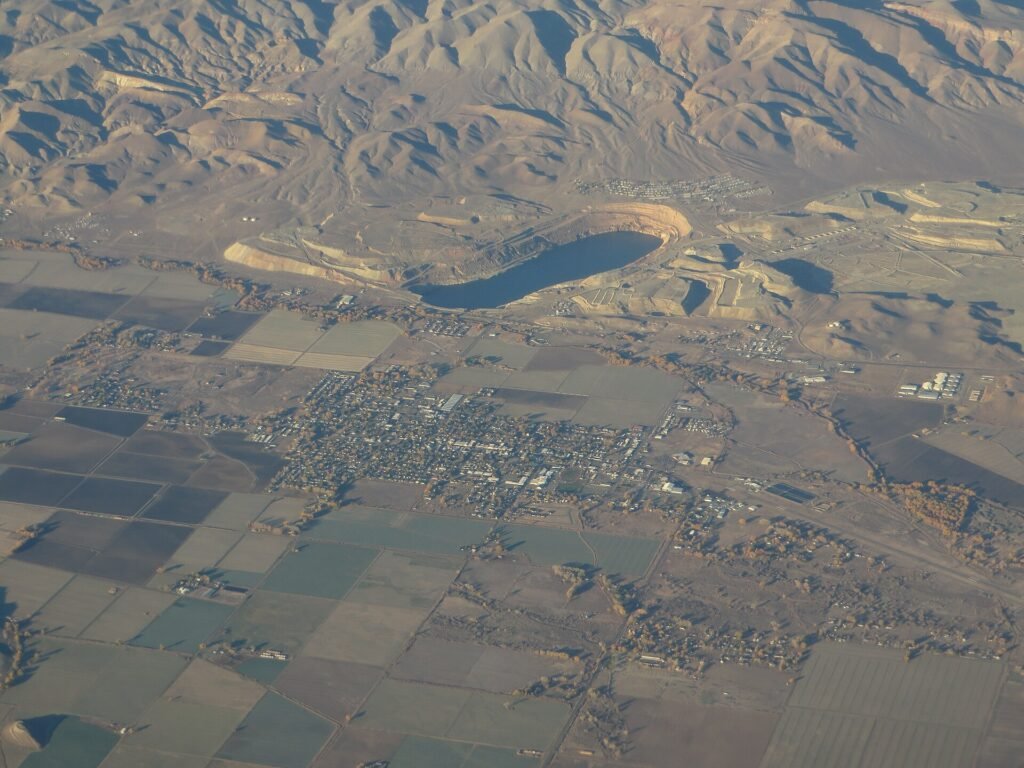
The U.S. Geological Survey’s Mineral Commodity Summaries 2026 puts the value of U.S. mineral production at about $112 billion, up 5.6% from the year before. The annual report covers 90 nonfuel mineral commodities and is the main U.S. government snapshot of supply, demand and trade for materials. This article summarizes the USGS news release and explains the main numbers.
What are the headline numbers?
The USGS reports these figures for the United States:
- Mineral production value: about $112 billion, up 5.6%
- Industries that rely on minerals: about $4.09 trillion in value added
- Net imports of processed metals and materials: up from $77 billion to $185 billion
- Western states’ production: up $6.8 billion to $32.8 billion
- China as a major import source: 14 of 33 critical minerals
By our own arithmetic, the rise in net imports is about 140%, and the $4.09 trillion is about 37 times the $112 billion of production value. The second comparison is ours and shows how much downstream activity depends on a relatively small mining base. The USGS does not make that comparison.
What drove the increase in value?
The USGS names gold, silver, copper and molybdenum as drivers of the higher value. It also reports that Arizona overtook Texas for second place among states by value of nonfuel mineral production, and that Nevada remained the top producer by value. Our separate articles on silver in 2025 and copper in 2025 cover two of those drivers in more detail.
What does the report say about lithium?
The USGS release reports that world lithium production rose 31% and world consumption rose 20%. The rise reflects growing use in batteries, a general point that is ours and not quoted. Our report on lithium covers the details of that market.
Why does reliance on China matter?
The USGS says China was a major import source for 14 of the 33 minerals on the U.S. critical minerals list used in the report. By our arithmetic, that is about 42% of the list. A major source means China supplied a large share of U.S. imports of those minerals, though the news release does not give the shares. Our articles on tungsten, cobalt and nickel show the pattern for individual metals, and the guide to rare earth elements covers a group where the concentration is well known.
How should the state rankings be read?
The USGS ranks states by the value of nonfuel mineral production, not by tonnage. Nevada leads, and Arizona moved ahead of Texas into second place. Because the ranking is by dollars, a state with high-priced metals such as gold and copper can rise even if its physical output is flat. By our own arithmetic, the Western states’ $32.8 billion is about 29% of the national $112 billion, though the release does not say which states are in that group, so the share is a rough guide only. Readers comparing states should look at both value and volume.
What does the import figure leave out?
The release reports net imports of processed metals and materials rising from $77 billion to $185 billion. It does not say how much of the change came from price, how much from volume and how much from the mix of materials. The release also gives no list of the products involved. For that reason, the figure is best read as a sign that the trade balance in processed materials changed a great deal, and not as a measure of any single supply chain. Where we have read individual commodity chapters, we report them in our separate articles instead.
How to read the numbers
Production value measures the dollar worth of minerals mined and processed in the United States, so it rises when prices rise, even if tonnage does not. That general explanation is ours. The jump in net imports of processed materials is a trade measure, and the news release does not break it down by mineral. A reader should avoid concluding that physical imports more than doubled, because price changes can account for part of a dollar figure.
What are mineral commodity summaries?
The Mineral Commodity Summaries is an annual publication with a chapter for each commodity. Each chapter gives production, trade, price, use and reserve estimates, with notes on events during the year. Our commodity articles in this series draw on those chapters, and each states which figures are estimates.
What should readers watch for next?
Readers can watch whether production value keeps rising if prices fall, whether the critical minerals list changes, and how trade measures affect import flows. The release covers 2025 and does not forecast.
Glossary
- Nonfuel mineral: a mined material other than coal, oil or gas
- Critical mineral: a mineral designated important to the economy with a vulnerable supply chain
- Net imports: imports minus exports
- Value added: the worth an industry adds to the materials it uses
- Apparent consumption: production plus imports minus exports and stock changes
These definitions are general explanations and are not quoted from the USGS.
What is not covered here?
We read the USGS news release and did not read the full report, so we do not give figures for individual commodities beyond our separate articles. The release gives no import shares for China.
Key facts at a glance
- U.S. mineral production value: about $112 billion, up 5.6%
- Commodities covered: 90
- Net imports of processed materials: $185 billion, from $77 billion
- Top state by value: Nevada; Arizona now second
- World lithium production: up 31%
Frequently asked questions
What is the Mineral Commodity Summaries?
It is the annual USGS report on supply, demand and trade for nonfuel minerals.
Which state produces the most by value?
Nevada, according to the USGS.
Does the United States depend on China for minerals?
China is a major import source for 14 of 33 critical minerals in the report.
More in Business
- Gold in 2025: USGS Reports a Record $3,300 Average Price and 3,300 Tons Mined
- Platinum-Group Metals in 2025: USGS Shows South Africa Mines 71 Percent of Platinum
- Aluminum in 2025: USGS Shows China Smelts 61 Percent as U.S. Tariffs Reach 50 Percent
- Bauxite and Alumina in 2025: USGS Shows Guinea, Australia and China Mine 76 Percent