A can of tuna is one of the most familiar foods on Earth, yet the fish behind it live far out of sight. They cross entire oceans, feed millions of people and support a market worth tens of billions of dollars. World Tuna Day, observed every year on May 2, asks a plain question: how do we keep taking this fish without running out of it? The answer in recent years has been more hopeful than many people expect. Most of the world’s commercial tuna now comes from stocks that scientists judge to be in good shape, which is unusual in fisheries. It is worth understanding how that happened and what could undo it. Like World Seagrass Day, it is a reminder that ocean health is a chain of connected living things.
A day born in a vote on the oceans
World Tuna Day did not start as a campaign. It came from a General Assembly decision on the oceans. On December 7, 2016, the Assembly took up its yearly agenda item on oceans and the law of the sea, and the President of the Assembly told delegates that the resolution before them would declare May 2 an annual World Tuna Day. The text recognizes the critical role of tuna in sustainable development, food security, economic opportunity and livelihoods. The date is fixed, so the day falls on May 2 every year.
The aim was not to celebrate one fish for its own sake. It was to draw attention to a resource that many countries rely on and that no single country can manage alone. Tuna swim through national waters and the open sea, so their future depends on cooperation.
What counts as tuna
The word covers a family of fast, powerful ocean fish. Five species dominate the commercial catch: skipjack, yellowfin, bigeye, albacore and bluefin. According to the International Seafood Sustainability Foundation (ISSF), skipjack makes up 58 percent of the global commercial catch, yellowfin 30 percent, bigeye 7 percent, albacore 4 percent and bluefin 1 percent. The most prized fish, bluefin, is a very small slice by weight. Skipjack is the workhorse of the industry, and purse seine nets take 66 percent of the total catch.
Example 1: reading the mix. Imagine a fleet lands 1,000 tonnes of tuna that matches the global mix. About 580 tonnes would be skipjack, 300 yellowfin, 70 bigeye, 40 albacore and 10 bluefin. These numbers are round and illustrative. They show why one rule for all tuna rarely works: managers must watch each species, because one can be under pressure while another is plentiful.
The numbers behind the day
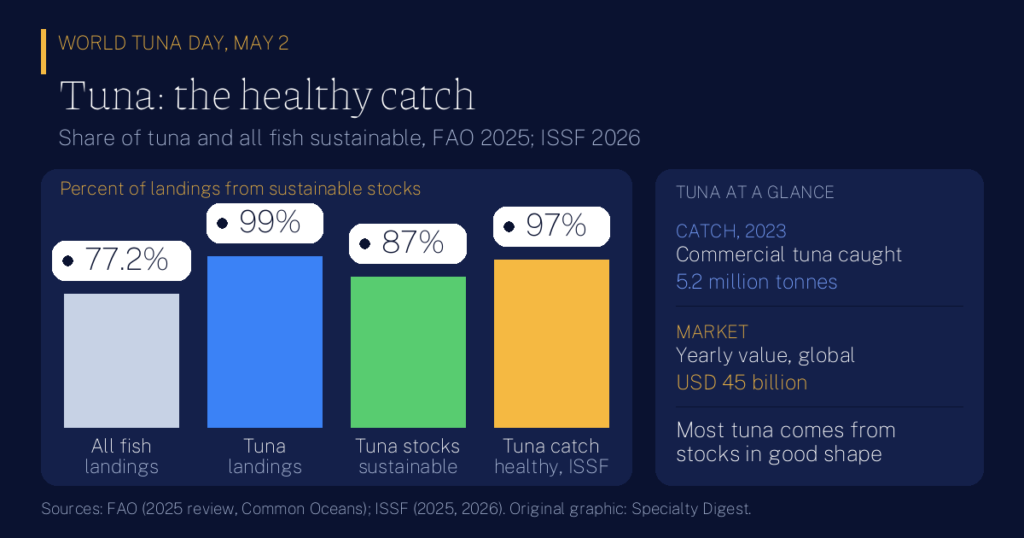
FAO reports that about 5.2 million tonnes of commercial tuna were caught in 2023. The global tuna market is worth about USD 45 billion a year, and tuna make up 6.5 percent of all fish caught at sea. More than 100 entities take part in the five tuna regional fisheries management organizations, the international bodies that coordinate how tuna are managed in each ocean.
- USD 45 billionyearly value of the global tuna market
- 5.2 milliontonnes of commercial tuna caught in 2023
- 6.5%of all fish caught at sea is tuna
- 100+entities take part in the five tuna management bodies
Against the rest of the sea, tuna stand out. In its 2025 review of marine fishery resources, FAO found that 64.5 percent of all assessed fish stocks are fished within biologically sustainable levels, while 35.5 percent are overfished. For tuna and tuna-like species, 87 percent of assessed stocks are sustainable. By landings the gap is wider: 77.2 percent of all landings come from sustainable stocks, compared with 99 percent for tuna.
A rare good-news story, with fine print
ISSF, a science-based group that works with industry and conservation partners, tracks 23 major commercial tuna stocks. In its March 2025 report, about 87 percent of the global catch came from stocks at healthy abundance levels. By its January 2026 report, the figure had reached 97 percent, 96 percent of the 23 stocks were not experiencing overfishing, and none was classed as overfished.
Why do FAO’s 99 percent and ISSF’s 97 percent differ? They measure different things with different methods: FAO counts landings from stocks judged biologically sustainable, while ISSF counts catch from stocks at healthy abundance. Both point the same way.
The average hides local problems. In a 2026 note on Somalia, FAO says skipjack and yellowfin are relatively numerous, but bigeye is under significant stress, and bigeye and albacore are already under threat from overfishing. Stock status there is assessed by the Indian Ocean Tuna Commission.
Example 2: how a stock stays healthy. Picture a stock that adds about 250,000 tonnes of new growth each year. If fishing removes 200,000 tonnes, the stock holds or grows. If fishing removes 300,000 tonnes, it shrinks year after year. The numbers are round and illustrative, but the logic is why catch limits and monitoring matter.
Who depends on tuna
For coastal communities, tuna is food, income and trade at once. FAO describes tuna as an essential source of income, nutrition and economic potential for coastal populations, and Somalia’s Ministry of Fisheries and Blue Economy is quoted calling it a vital pillar of food security and the economy. Fishers, crews, port workers, canneries and exporters all rely on healthy stocks, so a decline reaches far beyond the fish itself.
Example 3: a village boat. Suppose a small boat lands 10 tonnes of tuna in a season and sells it at $1,500 a tonne. That is $15,000 for a crew of five, or about $3,000 each before costs. If the stock thins and the catch halves, so does the income. The figures are round and illustrative, but they show how closely a household budget can track a stock assessment.
How the day is marked and what progress needs
Observance is practical. FAO offices and national fisheries agencies use May 2 to publish stock updates, discuss management and explain why tuna matter for food and jobs. The 2026 FAO Somalia note, for example, shows a government and a UN agency using the day to highlight the fish and its stock status.
What progress needs is not mysterious: assessments of every stock, catch limits that follow the science, honest reporting and enforcement across borders. The good numbers above exist because countries agreed to manage tuna together, and they can fade if that cooperation does. For readers, the day is a prompt to ask where your tuna comes from and whether its stock is assessed.
Key Takeaways
- The day comes from a UN vote. The General Assembly declared May 2 World Tuna Day on December 7, 2016.
- Tuna is a big, shared resource. About 5.2 million tonnes were caught in 2023, in a market worth about USD 45 billion a year.
- Tuna beat the sea average. FAO finds 87 percent of assessed tuna stocks sustainable, against 64.5 percent of all stocks.
- Good news is measured, not guessed. ISSF reports 97 percent of catch from healthy stocks in January 2026, up from 87 percent in March 2025.
- Species differ. Skipjack is 58 percent of the catch, while bigeye is under stress in some waters.
- Cooperation is the reason. Shared management across borders, backed by science, explains the progress and must continue.
How solid is this? Stock figures are scientific estimates revised with each assessment. FAO and ISSF use different methods, so their percentages are not interchangeable. The FAO tuna market value and sustainability shares come from its Common Oceans page, which gives no year for them. The three worked examples use round, made-up numbers to show an idea. See also World Seagrass Day, the International Days hub and the International Days Calendar.
More in Nature
- United Nations General Assembly President, Statement on oceans and the law of the sea, December 7, 2016
- United Nations, World Tuna Day observance page
- FAO Common Oceans Program, Tuna fisheries
- FAO, Review of the state of world marine fishery resources, 2025
- ISSF, 97% of global tuna catch comes from healthy stocks, February 9, 2026
- ISSF, 87% of global tuna catch comes from healthy stocks, March 12, 2025
- FAO Somalia, World Tuna Day note, 2026