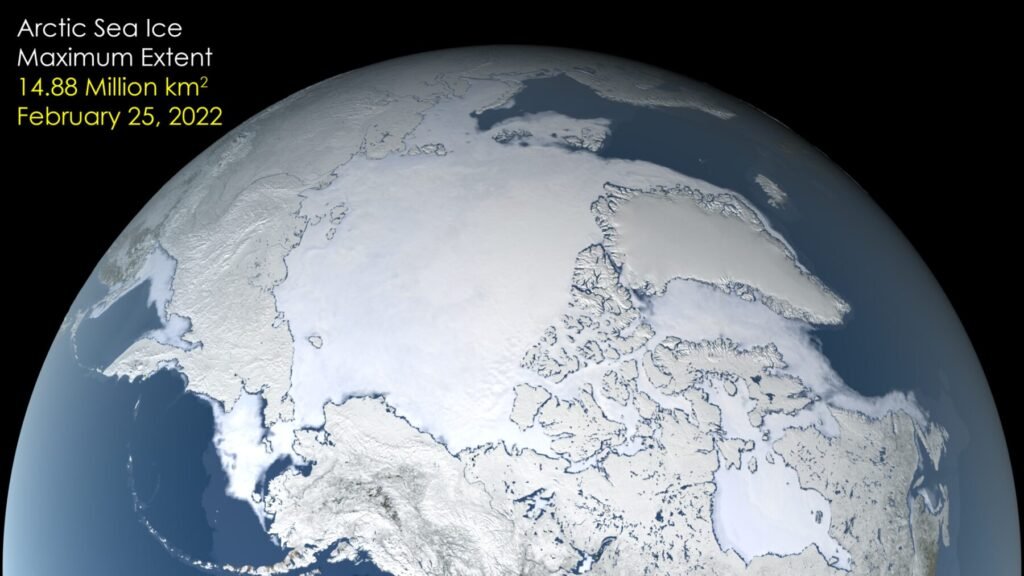
Arctic sea ice shrank to its 2026 minimum on September 12, covering 4.6 million square kilometers (1.78 million square miles), according to NASA and the National Snow and Ice Data Center (NSIDC). That ties several past years for the 10th-lowest minimum in the satellite record. This article on Arctic sea ice minimum 2026 explains the measurement, compares what different agencies report and sets out what the numbers do and do not show.
What did NASA and NSIDC report?
NASA’s Earth Observatory says the minimum came on September 12, 2026, at 4.6 million square kilometers. The 2026 value tied 2008, 2010 and 2025 for the 10th-lowest minimum since satellite records began. The lowest minimum was in September 2012. The page says each of the past 20 summers, from 2007 through 2026, ranks among the 20 lowest minimum extents. It also says the March 2026 maximum statistically tied the 2025 maximum for the lowest in the satellite record.
What is sea ice extent?
Extent is the total area of ocean where the ice concentration is above a set threshold, commonly 15%. That threshold is a general convention and is not quoted from NASA’s page. The minimum is the lowest point of the annual cycle, reached each September after the summer melt, and the maximum is the highest point, reached around March. NASA says satellite observation began in late 1978 with the Nimbus-7 satellite. Later sensors include the Defense Meteorological Satellite Program instruments from 1987, NASA’s Aqua satellite from 2002 to 2011 and Japan’s GCOM-W1 from 2025. These passive microwave sensors can see through clouds.
Why do agencies report different numbers?
Different organizations use different sensors, processing methods and averaging periods, so their values differ. The Copernicus Climate Change Service reported an annual Arctic minimum of 5.06 million square kilometers on September 13, the 14th lowest in the satellite record. The UK Met Office, using the OSI SAF Sea Ice Index, reported a September monthly extent of 5.34 million square kilometers, the 16th lowest, with the minimum on September 12. It also notes that NSIDC’s index ranks September 13th lowest, with a deficit of 1.60 million square kilometers from the 1981 to 2010 average. These numbers are not in conflict. A daily or five-day minimum is lower than a monthly average, and each agency’s algorithm treats the ice edge slightly differently. That explanation is general, and the agencies do not state it in the pages we used.
What does the thickness and age of the ice show?
NASA says the ice that remains is younger and thinner, and describes a decline in multiyear ice that leaves the Arctic dominated by thinner first-year ice. Multiyear ice has survived at least one summer melt, while first-year ice formed during the most recent winter. Those definitions are general. The page gives no thickness measurements, so we do not quote any.
Is the decline natural?
NASA states that the decline observed throughout the satellite record cannot be explained by natural variability alone. It also notes that September extent has been relatively steady in recent years, even though the long-term record shows lower ice in both winter and summer. A flat few years do not reverse a long decline, and the page presents both points together. Our article on the Arctic Report Card covers the wider changes in the region, and our article on permafrost thaw covers what is happening to the land.
How to read the numbers
The Met Office says the September 2026 Arctic extent was 1.43 million square kilometers below the 1981 to 2010 average and 0.93 million above the long-term linear trend. In other words, the year was well below the old average but above where a straight-line continuation of the decline would have put it. By our own arithmetic, 4.6 million square kilometers is 1.78 million square miles, which matches NASA’s own conversion. Comparing the NASA minimum of 4.6 million with the Copernicus 5.06 million shows a gap of about 0.46 million, a difference that comes from method rather than from two different Arctic summers.
Why does Arctic sea ice matter?
Sea ice reflects sunlight, so less ice means more sunlight absorbed by the ocean. That is a general physical point and is not made on the NASA page we used. The effects reach beyond the polar region, which is why scientists track the Arctic closely. Our article on climate tipping points discusses the parts of the Earth system that scientists watch for sharp changes, and our article on sea level rise covers a separate measure of change.
Glossary
- Sea ice extent: the area of ocean with ice concentration above a threshold
- Minimum: the lowest sea ice extent of the yearly cycle
- Multiyear ice: ice that has survived at least one melt season
- Passive microwave: a sensor type that detects natural microwave emission from the surface
- Baseline period: the years used to calculate an average for comparison
The extent, multiyear, passive microwave and baseline definitions are general explanations and are not quoted from NASA.
What is not covered here?
NASA’s page does not give the record-low value for 2012, the 2025 minimum or the March 2026 maximum in numbers. We have not supplied them from memory. Readers who need those figures should consult NSIDC directly.
Key facts at a glance
- 2026 minimum: 4.6 million square kilometers on September 12, per NASA and NSIDC
- Rank: tied 10th lowest with 2008, 2010 and 2025
- Lowest minimum on record: September 2012
- March 2026 maximum: statistically tied with 2025 for the lowest
- Satellite record start: late 1978
Frequently asked questions
How low did Arctic sea ice get in 2026?
4.6 million square kilometers on September 12, per NASA and NSIDC.
Was it a record low?
No. It tied for 10th lowest. The record low was in 2012.
Why do other agencies give different values?
They use different methods and averaging periods, so values and ranks differ.
Is Arctic ice getting thinner?
NASA says the remaining ice is younger and thinner.
More in Nature
- Antarctic Sea Ice 2026: Third-Lowest Maximum in the 48-Year Satellite Record
- September 2026 Was the Second-Warmest September on Record, Copernicus Reports
- Pennsylvania's Grand Canyon: NASA Landsat Shows Autumn Color in Pine Creek Gorge
- Emperor Penguins From Space: What Landsat Reveals About 66 Antarctic Colonies