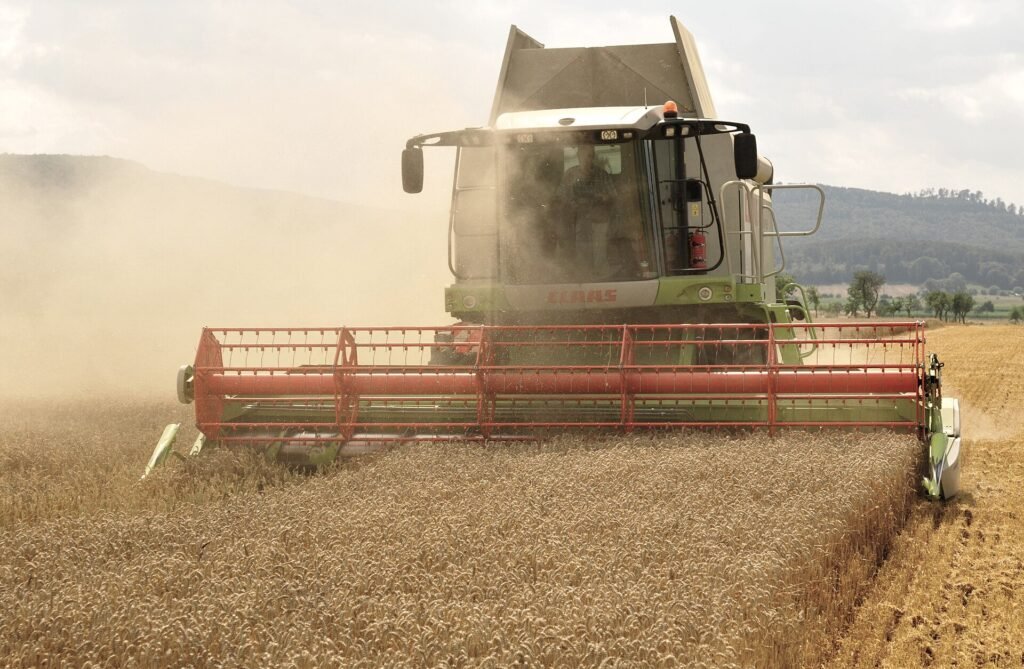
The United Nations Food and Agriculture Organization (FAO) said on October 2, 2026 that its Food Price Index rose to 136.0 points in September, up 1.5% from August. Higher prices for sugar, cereals and vegetable oils drove the increase, while meat and dairy edged down. This article sets out the FAO figures, explains how the index works and shows how to read the numbers.
What did the FAO report for September 2026?
The FAO Food Price Index (FFPI) stood at 136.0 points in September 2026. That is 2.0 points, or 1.5%, above the revised August level and 7.4 points, or 5.8%, above September 2025. It remains 24.3 points, or 15.1%, below the March 2022 peak. FAO’s headline said the index edged up on higher sugar, cereal and vegetable oil prices.
How did each food group move?
FAO reports five sub-indices:
- Cereals: 122.8 points, up 6.0 points (5.1%) from August and up 17.2% from a year earlier
- Vegetable oils: 198.6 points, up 1.8 points (0.9%) from August and up 18.3% from a year earlier
- Sugar: 114.0 points, up 6.5 points (6.1%) from August and up 14.7% from a year earlier
- Meat: 127.9 points, down 1.5 points (1.1%) from a revised August figure and roughly unchanged from a year earlier
- Dairy: 119.1 points, down 0.2 points (0.1%) from August and down 19.1% from a year earlier
By our own arithmetic, vegetable oils at 198.6 points are the highest of the five sub-indices, while sugar at 114.0 is the lowest.
What is the FAO Food Price Index?
The FFPI tracks monthly changes in international prices of a basket of commonly traded food commodities. FAO’s page says the weights are based on average export shares over 2014 to 2016. The page does not state the base period explicitly, though it refers to a base-period revision introduced in July 2020. The index measures international trade prices, not what shoppers pay in stores. Our entry on inflation explains the broader price concept, and our article on why economists ignore food and energy prices explains why food is often excluded from the core measure.
How to read the numbers
Index points are relative values, so only comparisons across months or years carry meaning. By our own arithmetic, the August level was about 134.0 points after revision, September 2025 was about 128.6, and the March 2022 peak was about 160.3. Those values come from subtracting FAO’s stated changes from 136.0 or adding them to it, and FAO does not print them on the page we used. For cereals, the 17.2% annual rise matches a rise of 18.0 points from about 104.8, which is a check on FAO’s own percentages. The figures are revised each month, so the August comparison uses the revised level and not the number first published.
Why do the sub-indices matter separately?
A single headline number can hide movement in opposite directions. In September, sugar and cereals rose sharply in a month while dairy was more than 19% lower than a year earlier. Someone who buys mostly wheat-based products and someone who buys mostly dairy would therefore see different trends in the commodity markets. This is a general point about averages and is not a statement from FAO. FAO’s page reports the numbers and does not break down the causes in the text we used, so we do not attribute the moves to specific events.
Why does food price data matter beyond markets?
Food is a large share of spending for lower-income households, so international price changes can affect how much food people can afford. FAO’s price index is a commodity measure, and the effect on a given country depends on exchange rates, local markets and policy, which the index does not capture. Our entry on food insecurity and food banks covers how access to food is measured and addressed at the community level.
When is the next update?
FAO’s 2026 schedule lists the next release for November 6, 2026, which will cover October. Because FAO revises prior months, the September figure of 136.0 may change slightly when the next release arrives. Readers who need the latest number should check FAO’s Food Price Index page directly.
How does this compare with earlier highs?
FAO places the September reading 15.1% below the March 2022 peak, which tells readers that prices have eased a long way from that high even though they are rising again on a one-year view. Both statements can be true at once, because the index fell after 2022 and has since moved up. The page we used gives the peak comparison but not the path in between, so we do not describe the months that followed the peak. Readers who want that history can open FAO’s full time series, which is linked from the same page.
Related reading: Phosphate Rock in 2025: USGS Shows China Mines 44 Percent and Morocco Holds 68 Percent.
Glossary
- Index point: a unit of relative value on a scale built from a reference period
- Sub-index: an index for one food group, such as cereals or dairy
- Export share weight: a weight based on how much of each commodity a group of countries exports
- Revision: an update to a previously published figure when new data arrive
- Peak: the highest value in a series, here March 2022
These definitions are general explanations and are not quoted from FAO.
What is not covered here?
The FAO page we used does not explain the causes of the monthly changes or give the base period for the index. We have not filled those gaps. For the underlying reasons, readers should consult FAO’s full release.
Key facts at a glance
- FFPI for September 2026: 136.0 points, up 1.5% from August
- Versus September 2025: up 5.8%
- Below the March 2022 peak by 15.1%
- Highest sub-index: vegetable oils at 198.6 points
- Next release: November 6, 2026
Frequently asked questions
What is the FAO Food Price Index?
A monthly measure of international prices for a basket of traded food commodities.
Did food prices rise in September 2026?
The index rose 1.5% from August, driven by sugar, cereals and vegetable oils.
Which group fell most from a year earlier?
Dairy, down 19.1%.
Is this what I pay at the store?
No. It measures international commodity prices, not retail prices.
More in Business
- World Energy Investment 2026: IEA Estimates USD 3.4 Trillion and a Tenfold Rise in Solar Additions
- Nickel in 2025: USGS Shows Indonesia Mines About Two Thirds of the World's Supply
- Cobalt in 2025: USGS Shows Congo Supplies Nearly Three Quarters After an Export Ban and Quotas
- Tungsten in 2025: USGS Shows China Mines About 79 Percent and Prices Near Double