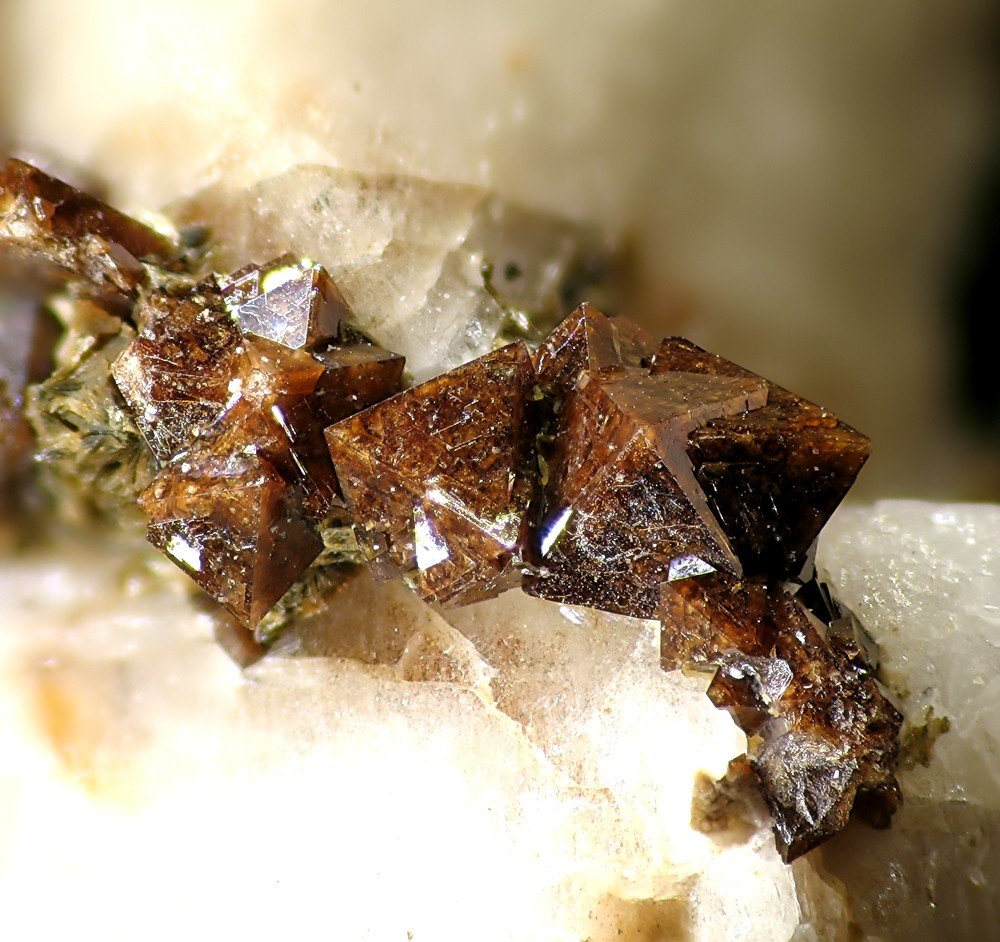
Niobium in 2025 was mined at an estimated 112,000 metric tons worldwide, unchanged from 2024, according to the U.S. Geological Survey’s Mineral Commodity Summaries 2026. Brazil supplied about 93% of it. The United States mines no niobium and imports all it uses, mostly as ferroniobium. This article summarizes the USGS niobium chapter, explains the main numbers and flags what the chapter does not say.
Who mines niobium?
The USGS lists estimated 2025 mine production, in metric tons of niobium content:
- Brazil: 104,000
- Canada: 6,000
- Congo (Kinshasa): 970
- Russia: 300
- Rwanda: 200
- China: 40
- Other countries: 120
By our own arithmetic, Brazil’s share is about 93% and Canada’s about 5%, which matches the USGS text. Together the two supply about 98%. Output in every producing country is close to its 2024 level in the table, so the market is concentrated and stable.
How much niobium is left?
The USGS puts world reserves above 21 million tons. Brazil holds 14 million, China 6.5 million, Canada 640,000 and the United States 210,000. By our arithmetic, Brazil holds about two thirds of reserves, and world reserves equal about 187 years of output at the 2025 rate, a rough guide only. The USGS says world resources are more than adequate for projected needs, and most identified resources are pyrochlore in carbonatite deposits, mostly outside the United States.
What is niobium used for?
The USGS gives U.S. uses of about 77% in steels and about 23% in superalloys. Niobium is added to steel in small amounts to make it stronger. Our reports on iron ore in 2025 and vanadium in 2025 cover related steel inputs.
How dependent is the United States on imports?
Net import reliance is 100% in every year from 2021 to 2025. Imports were an estimated 10,000 tons in 2025, against 9,820 in 2024 and 8,230 in 2021, and exports were 420 tons. The USGS puts the value of imports at about $525 million. For 2021 to 2024, Brazil supplied 67% of total imports and Canada 28%. By form, ferroniobium made up 68% of imports by niobium content, niobium metal 22%, niobium oxide 9% and ores and concentrates 1%.
Where do the imports of each product come from?
For 2021 to 2024, ferroniobium and niobium metal came from Brazil (65%) and Canada (31%). Niobium oxide came from Brazil (89%), Estonia (4%) and Thailand (4%). Niobium and tantalum ores and concentrates came from Australia (62%), Congo (Kinshasa) (9%), Mozambique (9%) and the United Arab Emirates (5%). The ore trade is tiny by weight, but it draws on a different set of countries from the main product trade.
What does Brazil export?
The USGS reports Brazilian ferroniobium exports of 92,000 tons in 2024 and 63,200 tons from January through August 2025. By our own arithmetic, the 2025 pace over eight months implies roughly 95,000 tons for a full year, a simple projection and not a USGS figure. Destinations were China (49%), the Netherlands (17%), Singapore (9%), South Korea (8%) and the United States (8%).
Is the consumption figure consistent?
The chapter text describes apparent consumption of 9,900 tons as a 6% decrease from 2024. The table, however, shows 9,340 tons in 2024 and 9,900 in 2025, which is a rise of about 6%. Reported consumption was 6,700 tons, against 6,600. We flag the conflict between text and table and do not choose between them. The ferroniobium price held at $26 per kilogram, against $25 in 2023.
What does the five-year record show?
Imports of niobium rose from 8,230 tons in 2021 to 9,110 in 2022, 10,100 in 2023, 9,820 in 2024 and an estimated 10,000 in 2025, a rise of about 21% by our own arithmetic. Exports fell from 992 tons to 420, about 58% lower. Apparent consumption rose from 7,240 to 9,900 tons, about 37%, while reported consumption moved only from 6,110 to 6,700, about 10%. The gap between the two measures widened, and the chapter does not explain why. The ferroniobium price rose from $21 per kilogram to $26, about 24%, with most of that gain by 2022.
What does 100% import reliance mean?
It means the United States has no mine production of niobium to offset imports. The USGS defines net import reliance as imports minus exports, as a share of apparent consumption, and says the figure was 100% in each of the five years. It does not mean that supply is at risk. Brazil, the main source, mines about 93% of the world total, and the chapter calls world resources more than adequate. The risk lies in concentration, not in the size of the resource.
How to read the numbers
All tonnages are niobium content, not ore weight. Apparent consumption equals production plus imports minus exports, so with no U.S. mine it is simply net imports plus stock changes. Estimates for 2025 are first reads that the USGS may revise.
How does niobium connect to other coverage?
Niobium is part of the steel alloy family. See our reports on molybdenum in 2025, manganese in 2025 and the USGS summary of U.S. mineral production.
What should readers watch for next?
Readers can watch Brazilian export volumes, Canadian output and the next USGS edition, which replaces estimates with reported data.
Related reading: Tantalum in 2025: USGS Shows Congo Mines 52 Percent as U.S. Use Jumps 58 Percent.
Glossary
- Ferroniobium: an iron and niobium alloy added to steel
- Superalloy: a metal alloy that keeps its strength at very high temperatures
- Pyrochlore: the main niobium ore mineral
- Carbonatite: a rare igneous rock rich in carbonate minerals
- Net import reliance: imports minus exports, as a share of apparent consumption
These definitions are general explanations and are not quoted from the USGS.
What is not covered here?
We omit the stockpile data, the scandium award mentioned in the chapter and any price forecast.
Key facts at a glance
- World mine production, 2025: about 112,000 tons
- Brazil: 104,000 tons, about 93%
- U.S. net import reliance: 100%
- Uses: about 77% steels, 23% superalloys
- World reserves: above 21 million tons
Frequently asked questions
Which country mines the most niobium?
Brazil, at an estimated 104,000 tons in 2025.
What is niobium used for?
Mostly to strengthen steel, with the rest in superalloys.
Does the United States mine niobium?
No. The USGS shows no U.S. mine output and 100% import reliance.
More in Business
- Tantalum in 2025: USGS Shows Congo Mines 52 Percent as U.S. Use Jumps 58 Percent
- Chromium in 2025: USGS Shows South Africa Mines 45 Percent of World Chromite
- Gallium in 2025: USGS Shows U.S. Metal Imports More Than Double as China Holds 99 Percent
- Germanium in 2025: USGS Shows U.S. Metal Imports Fall 67 Percent as Prices Double