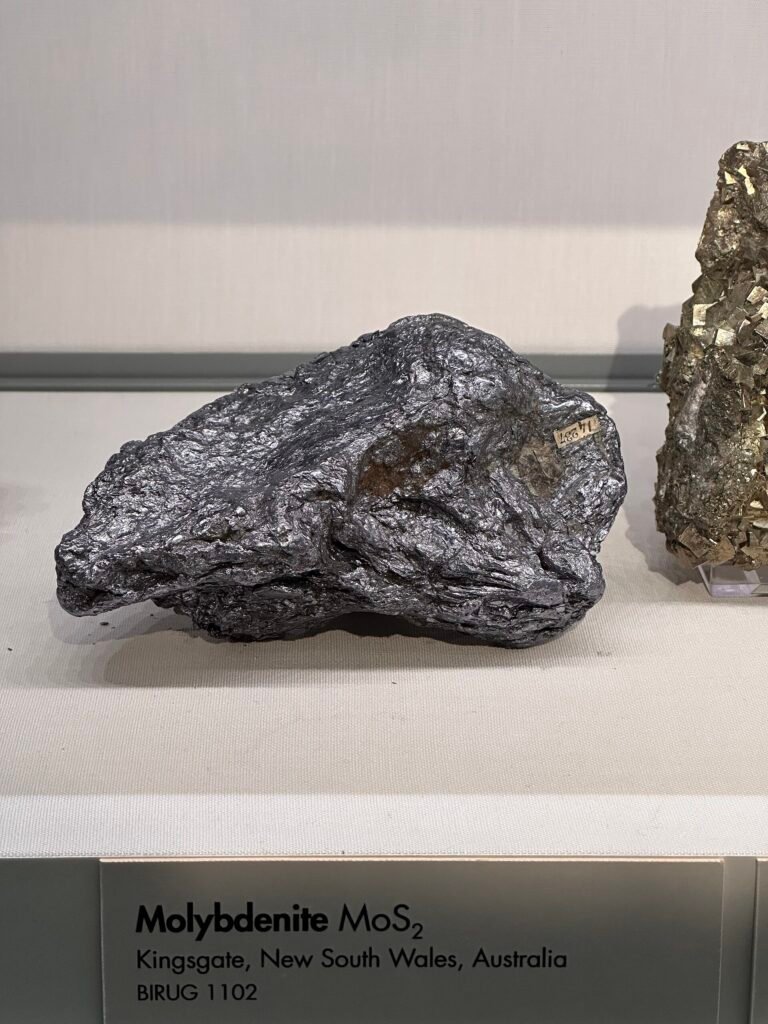
Molybdenum in 2025 was mined at an estimated 260,000 metric tons worldwide, up from 256,000 in 2024, according to the U.S. Geological Survey’s Mineral Commodity Summaries 2026. China, Chile, the United States, Peru and Mexico produced about 90% of it. U.S. mine output rose 18%. This article summarizes the USGS molybdenum chapter, explains the main numbers and flags what the chapter does not say.
Who mines molybdenum?
The USGS lists estimated 2025 mine production, in metric tons of molybdenum content:
- China: 97,000
- Chile: 42,000
- United States: 40,000
- Peru: 39,000
- Mexico: 17,000
- Armenia: 5,300
- Kazakhstan: 4,300
- Mongolia: 4,200
- Iran: 3,300
- Canada: 2,200
By our own arithmetic, China’s share is about 37%, and the five largest producers together mine about 90%, matching the USGS text. Armenia fell from an estimated 8,200 to 5,300, and Canada rose from 1,540 to 2,200. Peru fell from 41,900 to 39,000.
How much molybdenum is left?
The USGS puts world reserves at 17,000 thousand tons. China holds 7,800, the United States 3,500, Chile 2,600, Russia 1,100 and Peru 1,000. World resources are about 25.4 million tons, made up of 5.4 million in the United States and about 20 million elsewhere. By our arithmetic, reserves equal about 65 years of output at the 2025 rate, a rough guide only. The Australian reserve line carried a merged footnote mark, so we do not report it.
What is molybdenum used for?
The USGS describes molybdenum mainly as an alloying agent in cast iron, steel and superalloys, with chemical uses in catalysts, lubricants and pigments. The copy of the chapter we read gives no end-use percentages. It says recycled scrap may supply as much as 30% of apparent supply. Our report on copper in 2025 covers the metal that many molybdenum mines produce alongside.
How did U.S. production and trade change?
U.S. mine production rose from 34,000 tons in 2024 to an estimated 40,000, up 18%. Exports of ore and concentrates were about 27,000 tons, and imports of ore and concentrates were 17,000 against 14,700. Imports of primary products fell from 12,200 to 9,700, about 20% by our own arithmetic, while exports of primary products rose from 5,890 to 6,500. The USGS marks the United States as a net exporter in every year shown.
How did consumption and prices move?
Apparent consumption rose from 28,500 tons to an estimated 34,000, which is about 19% by our arithmetic and 18% in the chapter text. Reported consumption was 18,000. The table price is $51 per kilogram against $47.72, which is a rise, yet the text says the average molybdic oxide price fell 7%. The two may measure different products. We flag the conflict and do not resolve it.
Where do imports come from?
For 2021 to 2024, total imports came from Chile (36%), Peru (35%), Mexico (8%) and South Korea (7%), with other countries at 14%. Ferromolybdenum came mostly from Chile (74%) and South Korea (21%). Ore and concentrates came from Peru (69%), Mexico (15%) and Chile (12%).
What did the chapter note about trade controls and mines?
The USGS says China imposed export controls on molybdenum powders in February 2025. It also reports that a Canadian company plans to restart an Idaho mine in the second half of 2027. It gives the global output rise as 2% in 2025. These are reported events, and the chapter does not estimate their effect on prices or supply.
What does the longer record show?
U.S. mine production was 41,100 tons in 2021, 34,600 in 2022 and 34,000 in both 2023 and 2024 before the 2025 rise to 40,000, which is back near the 2021 level. Reported consumption rose slowly from 16,100 to 18,000 tons over the same years. The table price climbed from $35.62 per kilogram in 2021 to $54.32 in 2023, then eased to $47.72 and $51, so the 2025 figure is about 43% above 2021 by our own arithmetic. Consumer stocks stayed near 2,000 tons throughout. The record shows a mine sector that recovered while domestic use grew only slightly, which is why exports stay large.
Is the ore trade balanced?
Not quite. U.S. exports of ore and concentrates were about 27,000 tons in 2025 against imports of 17,000, a net outflow of about 10,000 tons by our own arithmetic. Total imports of 27,000 tons were almost level with 26,900 in 2024, while the USGS says exports rose 1%. Trade in molybdenum therefore runs in both directions.
How to read the numbers
All figures are molybdenum content, not ore weight. Net import reliance shows only the letter E, which means the United States exports more than it imports. Estimates for 2025 are first reads that the USGS may revise.
How does molybdenum connect to other coverage?
Molybdenum sits among the steel alloy metals. See our reports on vanadium in 2025, nickel in 2025 and tungsten in 2025, and the USGS summary of U.S. mineral production.
What should readers watch for next?
Readers can watch Chinese powder export rules, Chilean and Peruvian output, the Idaho restart and the next USGS edition, which replaces estimates with reported data.
Glossary
- Alloying agent: a metal added to another to improve strength or heat resistance
- Superalloy: a metal alloy that keeps its strength at very high temperatures
- Molybdic oxide: a roasted molybdenum concentrate sold to steelmakers
- Net exporter: a country that sells more than it buys
- Reserves: resources that can be mined economically today
These definitions are general explanations and are not quoted from the USGS.
What is not covered here?
We omit the Australian reserve line, the tariff schedule and any price forecast.
Key facts at a glance
- World mine production, 2025: about 260,000 tons
- China: 97,000 tons, about 37%
- U.S. mine output: 40,000 tons, up 18%
- Top five producers: about 90%
- China export controls on powders: February 2025
Frequently asked questions
Which country mines the most molybdenum?
China, at an estimated 97,000 tons in 2025.
What is molybdenum used for?
Mainly to strengthen steel, cast iron and superalloys.
Is the United States a net importer of molybdenum?
No. The USGS marks it as a net exporter.
More in Business
- Niobium in 2025: USGS Shows Brazil Mines 93 Percent and the U.S. Imports All It Uses
- Tantalum in 2025: USGS Shows Congo Mines 52 Percent as U.S. Use Jumps 58 Percent
- Chromium in 2025: USGS Shows South Africa Mines 45 Percent of World Chromite
- Gallium in 2025: USGS Shows U.S. Metal Imports More Than Double as China Holds 99 Percent