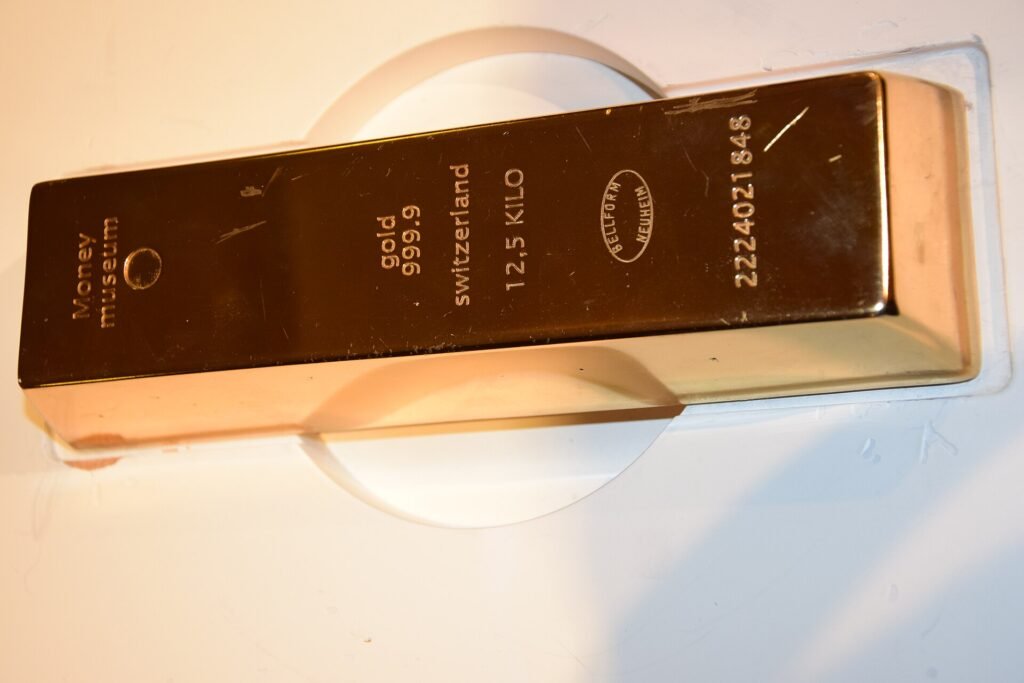
Gold in 2025 averaged a record $3,300 per troy ounce, up 38% from 2024, according to the U.S. Geological Survey’s Mineral Commodity Summaries 2026. The USGS also estimates that world mines produced about 3,300 metric tons of gold. This article summarizes the USGS gold chapter, explains the main numbers and flags what the chapter does not say.
Who mines gold?
The USGS lists estimated 2025 mine production, in metric tons of gold content, for the leading producers:
- China: 380
- Russia: 310
- Australia: 280
- Canada: 200
- United States: 160
- Ghana: 150
- Mexico: 140
- Kazakhstan, Uzbekistan and Peru: 130, 130 and 110
The world total is about 3,300 tons, against 3,280 in 2024. The USGS says China, Russia, Australia, Canada and the United States together produced 41% of the 2025 total. Gold output is spread widely, with about 1,000 tons coming from countries outside the named list. That is a sharp contrast with metals such as cobalt or tungsten.
How much gold is left in the ground?
The USGS puts world reserves at about 66,000 tons. Russia is listed at 12,000 tons, South Africa at 5,000 and Indonesia at 3,600. By our own arithmetic, world reserves equal about 20 years of output at the 2025 rate. That ratio is a rough guide only, because reserves change with prices and with new discoveries. We do not report the Australia reserve line, because it was garbled in the copy we could read.
What happened to the price?
The USGS estimates the 2025 average at $3,300 per troy ounce, based on January to November data, compared with $2,388 in 2024. It calls this a record annual price. Prices rose in the first two quarters, dipped at the start of the third quarter and rose again into early fourth quarter. The chapter does not give the year’s high and low, so we do not either.
What about the United States?
U.S. mines produced an estimated 160 tons, down from 163, with Nevada providing about 64% and Alaska about 22%. The USGS values U.S. mine output at about $17 billion, up 32%. Recycled gold of about 90 tons equaled roughly 60% of reported U.S. consumption. The Treasury’s stock of 8,130 tons has not changed since 2021. The USGS did not calculate net import reliance for 2025, because large unreported investor purchases make the figure meaningless. Imports for consumption rose to an estimated 320 tons from 190.
Who buys gold?
The USGS gives this global split of 2025 consumption, excluding exchange-traded funds:
- Jewelry: 40%
- Physical bars: 24%
- Central banks and other institutions: 21%
- Official coins, medals and imitation coins: 7%
- Electrical and electronics: 7%
- Other: 1%
For the first nine months of 2025 against the same period of 2024, the USGS reports total consumption up 10%. Physical bars rose 18%, while jewelry fell 20%, coins and medals fell 11% and dentistry fell 8%. Gold-backed exchange-traded funds and similar products took in 619 tons, more than 25 times the 2024 level for the same months.
What is the world output worth?
The USGS does not give a world value, so we calculated one. A metric ton holds about 32,150 troy ounces, so 3,300 tons is roughly 106 million ounces. At $3,300 an ounce, that is about $350 billion of gold mined in 2025, by our own arithmetic. The same method applied to U.S. output of 160 tons gives roughly $17 billion, which matches the USGS value for U.S. mines and supports the conversion. These are rough figures, because they apply an annual average price to the whole year and ignore the differences between mines and sales contracts.
Why is the share of the top five producers modest?
The five largest producers made 41% of the world total, which means that most gold comes from many other countries. Spread-out supply tends to make output less exposed to a single national policy. That is a general point and is not stated by the USGS.
How to read the numbers
Mine production barely moved, so the price jump came from demand and not from supply. The shift in demand is notable. Jewelry, the largest use, fell sharply, while bars and fund purchases grew. This is our reading of the USGS figures and not a statement in the chapter. The nine-month demand figures also cover only part of the year.
Why does recycling matter?
Gold is not used up like fuel, so old jewelry and electronics can be melted and sold again. That general explanation is ours and is not quoted from the USGS. The chapter shows the effect for the United States, where recycling supplied roughly 60% of reported consumption.
How does gold connect to other coverage?
Gold was a main driver of the higher value of U.S. mining in the USGS summary of U.S. mineral production. Silver, which moved in a similar way, is covered in our report on silver in 2025, and the copper in 2025 article shows another metal with record prices. The tungsten in 2025 report covers a metal where one country dominates mining.
What should readers watch for next?
Readers can watch whether investor demand keeps rising, whether jewelry demand recovers and how mine output responds to high prices. The chapter covers 2025 and does not forecast.
Glossary
- Troy ounce: a unit of weight for precious metals, about 31.1 grams
- Doré: an unrefined alloy of gold and silver from a mine
- Exchange-traded fund: an investment fund whose shares trade like stocks
- Net import reliance: imports minus exports as a share of consumption
- Reserves: resources that can be mined economically at current prices
These definitions are general explanations and are not quoted from the USGS.
What is not covered here?
We did not read the USGS notes on central bank purchases, because the figure in the copy we read was unclear. This article gives no investment advice and no price forecast.
Key facts at a glance
- World mine production, 2025: about 3,300 tons
- Average price: $3,300 per troy ounce, up 38%
- Top producer: China, 380 tons
- World reserves: about 66,000 tons
- Largest use: jewelry, 40%
Frequently asked questions
Which country mines the most gold?
The USGS lists China first, at 380 tons in 2025.
Was 2025 a record for the gold price?
Yes. The USGS calls the $3,300 average a record annual price.
Does the United States mine gold?
Yes, about 160 tons in 2025, mostly in Nevada and Alaska.
More in Business
- Platinum-Group Metals in 2025: USGS Shows South Africa Mines 71 Percent of Platinum
- Aluminum in 2025: USGS Shows China Smelts 61 Percent as U.S. Tariffs Reach 50 Percent
- Bauxite and Alumina in 2025: USGS Shows Guinea, Australia and China Mine 76 Percent
- Manganese in 2025: USGS Shows South Africa Mines 38 Percent and the U.S. Imports All It Uses