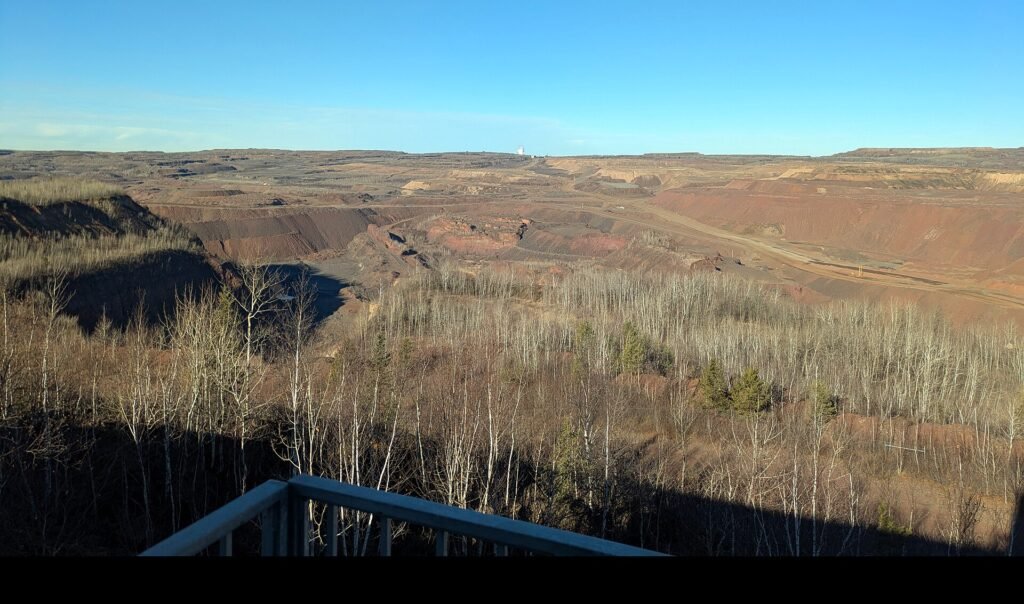
Iron ore in 2025 was mined at an estimated 2.6 billion metric tons worldwide, unchanged from 2024, according to the U.S. Geological Survey’s Mineral Commodity Summaries 2026. Australia mined the most, followed by Brazil and China. U.S. output fell 16% after two Minnesota mines were idled. This article summarizes the USGS iron ore chapter, explains the main numbers and flags what the chapter does not say.
Who mines iron ore?
The USGS lists estimated 2025 production of usable ore, in thousand metric tons:
- Australia: 980,000
- Brazil: 420,000
- India: 310,000
- China: 290,000
- Iran: 93,000
- Russia: 86,000
- Canada: 69,000
- South Africa: 66,000
- Ukraine: 52,000
- Kazakhstan: 35,000
- United States: 38,000
By our own arithmetic, Australia and Brazil together mined about 54% of the rounded world total. India rose from 282,000 to 310,000, about 10%, while Russia fell from an estimated 91,000 to 86,000. The USGS says the U.S. share of world output was about 1.4%.
How much iron ore is there?
The USGS puts U.S. resources at about 110 billion tons of usable ore, holding about 27 billion tons of iron, mainly low-grade taconite ores of the Lake Superior district. It puts world resources above 900 billion tons of ore, holding more than 260 billion tons of iron. The reserve table in the copy we read had misaligned columns without clear year labels, so we do not report country reserves.
What is iron ore used for?
Shipments to the U.S. steel industry took 98% of usable domestic iron ore products, and nonsteel uses took the remaining 2%. The USGS calls iron ore the only source of primary iron. It is turned into pellets, concentrates, sinter and other forms for steelmaking. Our report on manganese in 2025 covers another input to steel.
Why did U.S. output fall?
The USGS estimates U.S. production at 38 million tons in 2025, down 16% from 45.1 million in 2024, and says the decrease reflected two mines idled in March. The two Minnesota mines have a combined capacity of 10 million tons per year, and one was idled indefinitely while the other was idled partially. Shipments fell from 44.2 to 40 million tons, and the value of iron ore fell 25%, from $4.51 billion to an estimated $3.38 billion.
How did prices move?
The average unit value at U.S. mines was $89 per ton in 2025, down from $100.10 in 2024 and $156.42 in 2022, about 43% below the 2022 level by our arithmetic. The world benchmark moved the same way: $99.07 per ton in the first nine months of 2025 against $112.07 a year earlier, for 62% iron fines delivered to Tianjin Port. The USGS also reports that global finished steel demand was estimated flat in 2025, with falls in China offset by growth in Egypt, India, Saudi Arabia and Vietnam.
Is the United States a net importer?
No. The USGS lists the United States as a net exporter of iron ore in every year from 2021 to 2025. Exports fell from 10.5 million tons in 2024 to 7.8 million, while imports rose from 3.1 to 4.0 million. For 2021 to 2024, imports came from Brazil (58%), Canada (21%), Sweden (10%) and Chile (4%). Apparent consumption was 37 million tons in 2025, against 36.8 million.
What new projects and plants does the chapter mention?
A 7-million-ton-per-year iron mine and pelletizing project in Minnesota was set to restart construction, with startup expected in early 2026. Four iron metallics plants operated in 2025: one direct-reduced iron plant in Louisiana and three hot-briquetted iron plants in Indiana, Ohio and Texas. Two companies announced plans to explore rare earth extraction at iron ore deposits, one of them at a Nevada mine permitted for 11.5 million tons per year. Our report on rare earth elements explains why that interest exists.
How did the U.S. industry change?
Employment at U.S. iron ore operations fell from 4,900 people in 2024 to an estimated 4,300 in 2025, about 12% by our own arithmetic. Yearend stocks fell from 5.87 to 3.57 million tons. Iron metallics, which include direct-reduced and briquetted iron, held steady at about 5.2 million tons, worth an estimated $874 million, down 4%. The USGS expects pig iron output to rise to 21 million tons and raw steel to 82 million tons in 2025. Mines shrank while steelmaking inputs held up, which shows how the two parts of the chain can move apart.
How to read the numbers
Production is usable ore, which is ore after processing, while reserves are quoted both as crude ore and as iron content. Those are different bases, so they should not be compared directly. Figures marked estimated are first reads that the USGS may revise.
How does iron ore connect to other coverage?
Iron ore feeds the same supply chains as other metals. See our reports on zinc in 2025, nickel in 2025 and the USGS summary of U.S. mineral production.
What should readers watch for next?
Readers can watch the Minnesota restart, Chinese steel demand and the next USGS edition, which replaces estimates with reported data.
Related reading: Niobium in 2025: USGS Shows Brazil Mines 93 Percent and the U.S. Imports All It Uses.
Glossary
- Usable ore: ore after crushing, concentrating or other processing
- Pellets: small balls of concentrated ore fed to steel furnaces
- Direct-reduced iron: iron made from ore without melting it
- Net exporter: a country that sells more than it buys
- Reserves: resources that can be mined economically today
These definitions are general explanations and are not quoted from the USGS.
What is not covered here?
We omit country reserve lines whose year labels were unclear, the tariff schedule and any price forecast.
Key facts at a glance
- World mine production, 2025: about 2.6 billion tons
- Australia: 980 million tons
- U.S. output: 38 million tons, down 16%
- U.S. mine unit value: $89 a ton
- Steel industry: 98% of U.S. use
Frequently asked questions
Which country mines the most iron ore?
Australia, at an estimated 980 million tons in 2025.
What is iron ore used for?
Almost entirely steelmaking.
Why did U.S. output fall?
The USGS cites two Minnesota mines idled in March.
More in Business
- Potash in 2025: USGS Shows Canada Makes 31 Percent as U.S. Imports 92 Percent
- Phosphate Rock in 2025: USGS Shows China Mines 44 Percent and Morocco Holds 68 Percent
- Titanium Minerals in 2025: USGS Shows China Mines a Third of Ilmenite
- Magnesium Compounds in 2025: USGS Shows China Mines 60 Percent of Magnesite