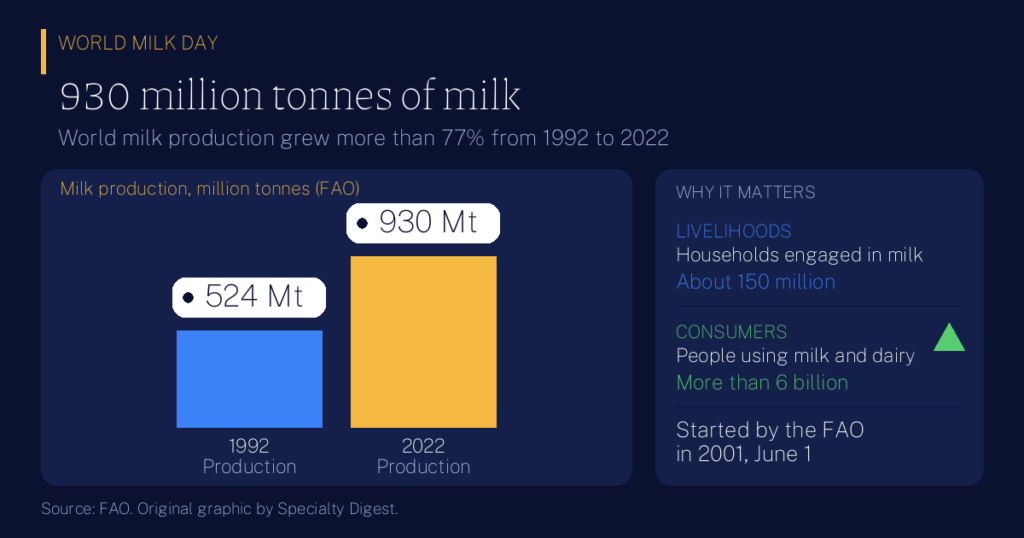
A glass of milk is one of the most ordinary things on Earth, and one of the most widely shared. According to the Food and Agriculture Organization of the United Nations (FAO), more than 6 billion people consume milk and milk products. World Milk Day, marked every June 1, asks us to look at that everyday food as a global system: a source of nutrition, a livelihood for farming families, and a pressure on the climate. It falls on the same date as the Global Day of Parents, and like that day it points to the daily work of feeding and caring for families.
A day started by the FAO
World Milk Day began with the FAO, which initiated it in 2001. The FAO explains that milk is one of the most widely produced and valuable agricultural commodities in the world, and that it supports food security, nutrition and economic development. The day was designed as an occasion to spread that message. June 1 was chosen because a number of countries already held a national milk day on or around that date.
One point deserves care. Unlike World Water Day, World Milk Day does not rest on a United Nations General Assembly resolution. The FAO states on its own page that the day is yet to be recognized as an official international day by the United Nations. It is an FAO-initiated observance, celebrated in more than 40 countries, and this article treats it that way. The FAO page also lists no yearly theme.
What counts as milk and dairy
The FAO uses the Codex Alimentarius definition: a milk product is a product obtained by any processing of milk, which may contain food additives and other ingredients functionally necessary for the processing. That covers cheese, yogurt, butter, cream, milk powder and much more. By volume, liquid milk is the most consumed dairy product across the developing world.
Milk also comes from more than one animal, and its makeup depends on the species. FAO nutrition material describes milk as either high in or a source of calcium, depending on the animal, and notes that the calcium in milk is highly bioavailable compared with many other foods, which means the body absorbs it well. Milk is also described as a good source of high-quality protein.
The numbers: a world that makes more milk
World milk production rose by more than 77 percent, from 524 million tonnes in 1992 to 930 million tonnes in 2022, according to the FAO. India is the largest milk producer in the world, with 22 percent of global production, followed by the United States, Pakistan, China and Brazil. About 150 million households around the globe are engaged in milk production. The FAO does not date those last two figures on its page, so treat them as approximate.
The map of growth has shifted. The FAO reports that developing countries have increased their share of dairy production in recent decades, and that most of the expansion since the 1970s has been in South Asia. It adds that this growth has come mostly from more producing animals rather than higher output per animal.
Example 1: pooling milk. Imagine 100 village households that each have 5 liters of milk to sell every day. Alone, each has too little to justify a trip to a distant buyer. Together they offer 500 liters a day, enough for one collection point with a cooling tank. The numbers are round and illustrative, but the logic of pooling is why shared collection matters to small producers.
Who drinks how much
Consumption is uneven. The FAO notes that per capita consumption of milk and milk products is higher in developed countries, though the gap with many developing countries is narrowing. Since the early 1960s, per capita milk consumption in developing countries has increased almost twofold. Over the same period, meat consumption has more than tripled and egg consumption has increased fivefold. In one region the trend runs the other way: over the last two decades, per capita milk consumption decreased in sub-Saharan Africa.
Example 2: the household gap. Take a family of four. At the low band’s ceiling of 30 kilograms per person, the household has about 120 kilograms of milk a year. At the high band’s floor of 150 kilograms per person, it has about 600. The figures use the FAO’s band thresholds as round, illustrative numbers, and they show that the gap between bands is at least fivefold.
Why it matters: nutrition
The FAO calls milk an important source of dietary energy, high-quality proteins and fats. How much of a diet it supplies depends on where people live. Milk provides 5 to 8 percent of dietary protein supply in Africa and Asia, compared with 20 percent in Europe. For fat, the shares are 6 to 9 percent in Africa and Asia, and 12 to 16 percent in Europe, Oceania and the Americas.
These are shares of supply, not dietary advice. They do show how unevenly the nutrition in milk is distributed around the world, and why the FAO ties the day to food security.
The climate question
Milk comes with an environmental bill. An FAO assessment published in 2023 found that livestock agrifood systems accounted for approximately 6.2 billion tonnes of carbon dioxide equivalent in 2015, around 12 percent of all human-caused greenhouse gas emissions. By commodity, meat production accounts for two-thirds of those emissions, milk 30 percent and eggs the rest. Without interventions and productivity gains, the same report says meeting rising demand could push livestock emissions to nearly 9.1 billion tonnes by 2050.
An earlier FAO assessment, published in 2010 with 2007 data, put the whole dairy sector, including meat from dairy animals, at around 4 percent of global emissions, with milk production, processing and transport alone at 2.7 percent. The two studies measure different things in different years, so their figures should not be added or compared directly.
- 12%of human-caused emissions come from livestock agrifood systems, 2015
- 30%of livestock emissions are from milk, by commodity, FAO 2023
- 20 timesspread in the emission intensity of cattle milk in grassland systems
- 2.7%of global emissions from milk production, processing and transport, 2007 data
The spread matters. The FAO finds that the average emission intensity of cattle milk in grassland systems varies by a factor of 20, which suggests that how milk is produced counts as much as how much is produced.
Example 3: two herds. Imagine two herds that each produce 1,000 liters a day. If the first has an emission intensity of 1 unit per liter and the second 20 units per liter, the second herd emits as much as twenty herds like the first. The units are made up for illustration, but the factor of 20 is the size of the range the FAO reports.
Who is left out, and how the day is marked
Behind the statistics are families. With about 150 million households engaged in milk production, dairy is an income source as well as a food, and the FAO links milk to food security and economic development. Yet the trend in sub-Saharan Africa, where per capita consumption has fallen, shows that growth in world output does not reach everyone equally. Because World Milk Day is an FAO-initiated observance rather than a UN resolution day, it has no formal program or fixed theme. It works as an invitation to learn where milk comes from, who produces it, and what it costs the planet.
Key Takeaways
- The day is the FAO’s own. The FAO initiated World Milk Day in 2001, and it is not yet an official UN international day.
- Milk feeds a majority of the world. More than 6 billion people consume milk and milk products.
- Production keeps growing. Output rose from 524 million tonnes in 1992 to 930 million tonnes in 2022.
- Growth is concentrated in the developing world. India leads with 22 percent of global production, and South Asia drove much of the expansion since the 1970s.
- Access is uneven. Milk supplies 5 to 8 percent of dietary protein in Africa and Asia but 20 percent in Europe, and consumption has fallen in sub-Saharan Africa.
- Climate cost depends on practice. Milk is 30 percent of livestock emissions, and the FAO finds a 20-fold range in the intensity of cattle milk in grassland systems.
How solid is this? Production figures come from the FAO and are for 1992 and 2022. The FAO does not date its figures for India’s share, the 150 million households, the per capita bands or the nutrition shares. Emissions figures come from two FAO assessments with different scope and base years (2015 and 2007). The three worked examples use round, made-up numbers to show an idea. See also the International Days hub and the International Days Calendar.
More in Health
- FAO, World Milk Day
- FAO, Dairy production and products: Milk production
- FAO, Dairy production and products: Products
- FAO, Gateway to dairy production and products
- FAO, Milk and Dairy Products in Human Nutrition (Q&A)
- FAO, New report maps pathways towards lower livestock emissions (2023)
- FAO, New report assesses dairy greenhouse gas emissions (2010)