Every second, people are born, grow old and die, and the sum of those moments shapes everything else: how many schools a country needs, how many nurses, how much food and water, how many workers support how many retirees. World Population Day, observed every year on July 11, asks the world to look at that sum and the choices behind it. It is not a day about telling anyone how many children to have. It is about the conditions that let people decide for themselves, and about what the numbers mean for the shared future. The same pressures between people and resources are a theme of World Water Day.
From a number to a United Nations day
The day began with a milestone. On July 11, 1987, the world marked the “Day of Five Billion,” a symbolic moment when the global population was counted as reaching five billion people. The interest it sparked led the Governing Council of the United Nations Development Programme to establish World Population Day in 1989 to focus attention on population issues. It was first marked on July 11, 1990, in more than 90 countries. In December 1990, the General Assembly adopted resolution 45/216, deciding to continue observing the day to raise awareness of population issues.
What demographers actually measure
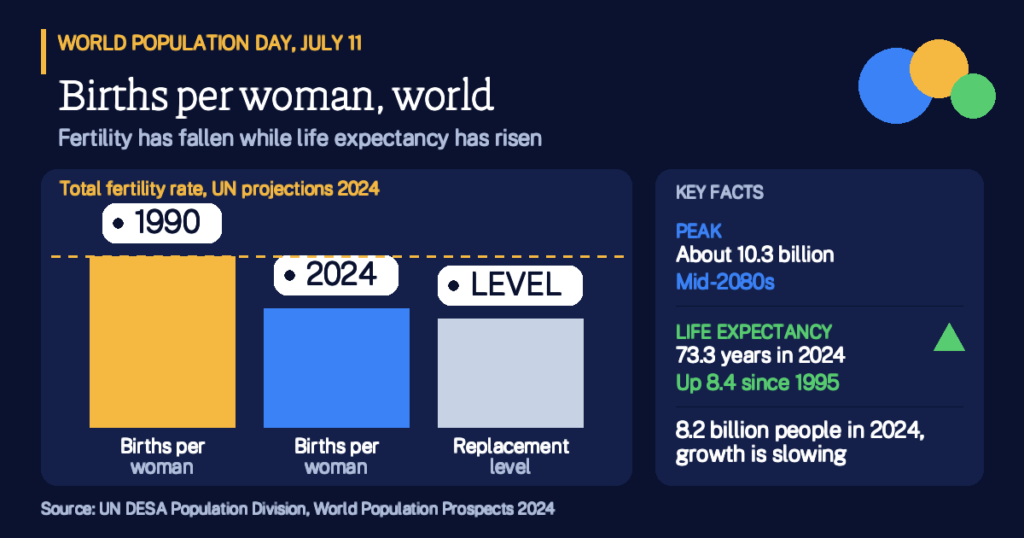
Demography is the study of how populations change, and it rests on a few simple ideas. Births add people, deaths remove them, and migration moves them between places. The total fertility rate is the average number of children a woman would have over her lifetime. A rate of about 2.1 is called replacement level, because two children replace two parents and a small margin covers those who do not survive to adulthood. Above it, a population tends to grow. Below it, a population tends to shrink over time, unless migration fills the gap. Life expectancy shapes the other side of the story, because people living longer add to the population and change its age mix.
The numbers behind the day
The UN Population Division, part of the Department of Economic and Social Affairs, publishes the standard projections. Its 2024 edition put the world at about 8.2 billion people in 2024. It expects growth for roughly another 60 years, to a peak of around 10.3 billion in the mid-2080s, followed by a gentle decline to about 10.2 billion by 2100. The Division assigns an 80 percent probability that the population peaks within this century, up from about 30 percent a decade earlier. Growth is slowing, not racing ahead.
The story differs sharply by country. In 63 countries and areas, home to 28 percent of the world’s people in 2024, the population had already peaked before that year. China, Germany, Japan and the Russian Federation are among them. Another 48 countries and areas, holding 10 percent of people, are expected to peak between 2025 and 2054. And 126 countries and areas will keep growing through 2054, with peaks later in the century or beyond 2100.
Example 1: what a peak looks like. Imagine a country of 20 million people whose population shrinks by half a percent each year. After the first year it has lost about 100,000 people, and after a decade about 1 million. The numbers are round and illustrative, but they show why a slow decline can still reshape schools, housing and budgets.
Fewer children, longer lives
Two long trends sit under the headline. In 2024 the global fertility rate stood at 2.3 births per woman, down from 3.3 in 1990, which means a woman today has about one child fewer than in 1990. More than half of all countries and areas now have fertility below the replacement level of 2.1, and nearly a fifth, including China, Italy, the Republic of Korea and Spain, have “ultra-low” fertility of fewer than 1.4 births per woman. At the same time, global life expectancy at birth reached 73.3 years in 2024, an increase of 8.4 years since 1995.
Example 2: why 1.4 matters. Picture 100 couples, or 200 parents. At replacement level, they have about 210 children and the next generation is roughly the same size. At 1.4 births per woman, they have about 140, so the next generation is about 30 percent smaller. The figures are round and illustrative, but this is the arithmetic that makes low fertility so consequential over a few generations.
An older world, and why it matters
Longer lives and fewer births change the age mix. By the mid-2030s, people aged 80 and over are projected to outnumber infants, reaching 265 million. By the late 2070s, the population aged 65 and older is projected to reach 2.2 billion, more than the number of children under 18. Meanwhile, many countries have a very young population, and the Division projects that countries with the youngest age structures will account for 79 percent of the population increase through 2054, about 1.4 billion people.
- 8.2 billionpeople in the world in 2024
- 73.3 yearsglobal life expectancy at birth, 2024
- 265 millionpeople aged 80 and over by the mid-2030s
- 2.2 billionpeople aged 65 and over by the late 2070s
Example 3: the support ratio. Suppose a town has 1,000 working-age residents and 200 people aged 65 or older, a ratio of five to one. If the older group grows to 400 while the working-age group stays the same, the ratio falls to 2.5 to one. The numbers are made up for illustration, yet they capture the question planners face: how to pay for health care, pensions and care work in an older society, and how to welcome the young workers that other countries will have in abundance.
The choice behind the numbers
UNFPA, the UN sexual and reproductive health agency, argues that the headline rates hide a more personal question. Its State of World Population 2025 report, called “The real fertility crisis,” drew on a UNFPA and YouGov survey in 14 countries that together hold over a third of the world’s people. It found that one in five people expect not to have the number of children they want. More than half named economic issues as a barrier, one in five reported being pressured to have children when they did not want to, and one in three adults had experienced an unintended pregnancy. UNFPA concluded that the gap lies in the lack of choice rather than in desire, and it warned that baby bonuses or fertility targets are largely ineffective and can violate human rights.
How the day is marked in 2026
The official 2026 theme is “Realizing the hopes and aspirations of young people, today and for the future.” It reflects UNFPA’s Demographic Futures Survey, which asked more than 100,000 internet-connected people aged 18 to 39 in 73 countries about their lives and plans. According to UNFPA’s summary of the findings, 88 percent rated financial security as the main prerequisite for becoming a parent, and 57 percent named economic and housing constraints as the main barriers to forming a family. UNFPA reads this as a sign that delayed or smaller families respond to conditions that are not yet supportive, not to an unwillingness to have a family. Each year the day is marked with events, reports and discussions in countries around the world.
Key Takeaways
- The day grew from a milestone. It followed the Day of Five Billion in 1987, was created in 1989, and was backed by General Assembly resolution 45/216 in 1990.
- Growth is slowing. The UN projects a peak near 10.3 billion in the mid-2080s, with about an 80 percent chance of a peak this century.
- Countries are on different paths. 63 countries and areas had already peaked by 2024, while 126 keep growing through 2054.
- Families are smaller and lives longer. Fertility fell from 3.3 to 2.3 births per woman from 1990 to 2024, and life expectancy reached 73.3 years.
- Ageing is the big shift. People aged 65 and over are projected to outnumber children under 18 by the late 2070s.
- Choice is the core issue. UNFPA stresses that people need the means and security to decide if and when to have children.
- Young people are at the center in 2026. Their hopes, and the barriers to them, frame this year’s theme.
How solid is this? Population figures are modeled estimates and projections from the UN Population Division’s 2024 edition, and they are revised with each release. The survey findings come from UNFPA and its partners and reflect the countries and groups surveyed, not the whole world. The three worked examples use round, made-up numbers to show an idea. See also the International Days hub and the International Days Calendar.
More in Society
- United Nations. World Population Day: background.
- United Nations. World Population Day.
- UN DESA Population Division. World Population Prospects 2024: key messages (July 2024).
- UN News. Growing or shrinking? What the latest trends tell us about the world’s population (11 July 2024).
- UNFPA. State of World Population 2025: The real fertility crisis (press release, June 2025).
- UNFPA. World Population Day 2026.
- UNFPA Indonesia. World Population Day 2026: youth want families but face systemic barriers (July 2026).