Walk to the edge of a tropical coast and you may meet a forest that stands in salt water, its roots arching above the mud like a crowd of stilts. Mangroves look strange because they live where most trees cannot. They grow in the tidal zone between land and sea, and they quietly do work that engineers struggle to copy: slowing storm waves, trapping sediment, sheltering young fish and locking away carbon. The International Day for the Conservation of the Mangrove Ecosystem, observed every July 26, asks the world to notice these forests before more of them are gone. It is a close relative of World Oceans Day and World Wetlands Day, because mangroves sit where the two meet.
How the day came to be
The day was established by UNESCO. According to UN News, the proclamation was adopted in November 2015 by the General Conference of UNESCO, and the first observance followed on July 26, 2016. UNESCO describes its aim plainly: to raise awareness of the importance of mangroves and to promote their sustainable conservation. The organization supports that aim through several of its own networks, including biosphere reserves, World Heritage sites, geoparks and its work on blue carbon. In 2016, UN News reported that 86 of the 669 sites in UNESCO’s World Network of Biosphere Reserves included areas of mangroves.
What a mangrove really is
“Mangrove” names a way of living, not a single species. Many unrelated trees and shrubs have evolved the same tricks to survive salt, mud and tides, such as roots that rise above the waterline to breathe. Together they form a coastal ecosystem found along the shores of 123 countries and territories, according to FAO. Beyond the trees themselves, the ecosystem includes the fish, crabs, birds and soil life that depend on them, and the people who fish, gather wood and live behind them.
The numbers behind the day
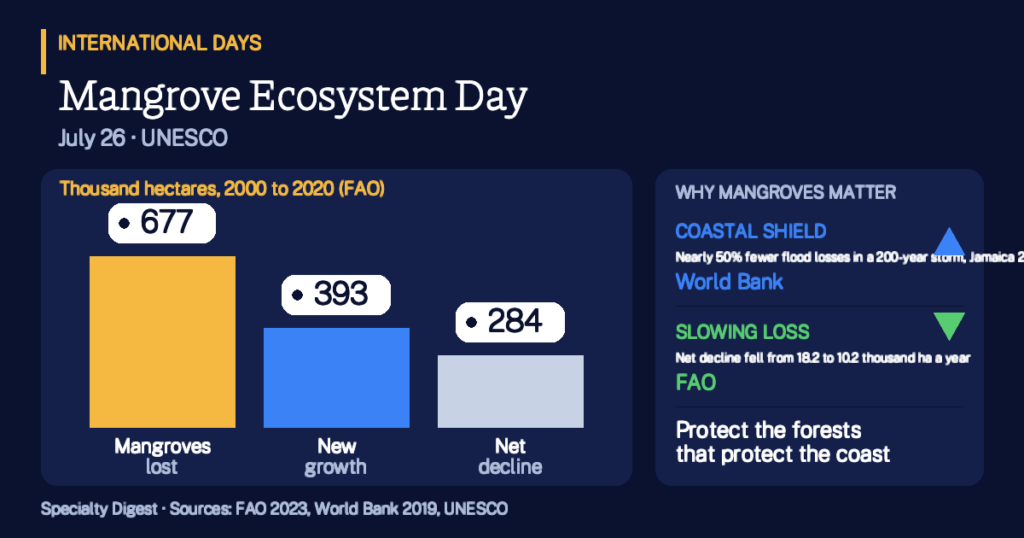
FAO’s 2023 report, The World’s Mangroves 2000 to 2020, estimated the global area of mangroves in 2020 at 14.8 million hectares. Nearly 44 percent of that, about 6.48 million hectares, lies in South and Southeast Asia. The report also gives a rare piece of good news. Between 2000 and 2020, 677,000 hectares of mangroves were lost, but 393,000 hectares of new mangrove forest grew where there had been none, offsetting more than half of the loss. The net decline was 284,000 hectares.
- 14.8 million haglobal mangrove area in 2020, FAO
- 123countries and territories with mangroves, FAO
- 44%of mangroves are in South and Southeast Asia, 2020
- 3,754 tonsof carbon one hectare can store, per UNESCO
The pace of loss has slowed. FAO reports that the net decline averaged 18.2 thousand hectares a year in 2000 to 2010 and 10.2 thousand hectares a year in 2010 to 2020, a drop of 44 percent. The annual rate of decline fell from 0.12 percent a year across the full two decades to 0.07 percent a year in the second decade. Looking back further, FAO says over 20 percent of mangroves are estimated to have been lost globally over the past 40 years.
Example 1: reading the net figure. Suppose a coastline loses 70 hectares of mangrove to ponds and storms, while 40 new hectares take root on fresh mud. The net loss is 30 hectares, less than half the gross loss. The numbers are round and illustrative, but they mirror the FAO pattern: a small net change can hide a large amount of loss and a large amount of recovery.
What is taking mangroves away
The causes are mixed. FAO calls pond shrimp aquaculture one of the main causes of loss, responsible for 31 percent of all loss between 2000 and 2010 and 21 percent between 2010 and 2020. It adds that most aquaculture practices do not affect mangroves. The second most important driver is natural retraction, which caused 26 percent of loss over the 20 years and which FAO says is at least partly driven by climate change effects such as rising sea levels and temperatures. Natural disasters caused only 2 percent of all loss over the period, though the area they destroyed increased threefold.
Gains matter too. FAO says natural expansion accounted for 82 percent of all gains between 2000 and 2020, and planting and restoration for the remaining 18 percent. Letting mangroves regrow where conditions allow is often as important as planting.
Why a muddy forest matters so much
The first reason is protection. UNESCO states that a 500-meter strip of mangrove can reduce wave heights by 50 to 99 percent, a claim it presents without a cited study, so treat it as a general range rather than a promise for any one shore. A more specific study comes from the World Bank. In its 2019 Forces of Nature analysis of Jamaica, the loss of current mangroves would raise the population facing annual flooding by over 10 percent, an extra 1,458 people, many of them living in poverty. Annual damage to residential and industrial property would rise by nearly 24 percent, or more than US$32.6 million. In a 200-year storm, mangroves reduce both the number of people flooded and the damage avoided by nearly 50 percent.
Example 2: a village behind the trees. Imagine a coastal village that suffers $1 million in storm damage in a typical year. If losing its mangroves raised damage by 24 percent, as in the Jamaica study, the yearly bill would climb by $240,000. The figures are round and illustrative, and real results differ by coast, but the logic shows why a standing mangrove can be cheaper than a sea wall.
The second reason is carbon. UNESCO says one hectare of mangrove can store 3,754 tons of carbon, and that mangrove deforestation causes up to 10 percent of global deforestation emissions even though mangroves cover only 0.7 percent of land. Those are UNESCO’s figures as published, and the page gives no year for them. The third reason is livelihoods. The World Bank’s Jamaica study found that mangroves contribute between US$5,218 and US$54,145 in mixed fisheries per hectare per year, depending on the site, and more than US$2,500 per hectare per year in direct flood protection from tropical cyclones.
Example 3: counting carbon. If a restoration project secured 1,000 hectares of healthy mangrove and each stored the UNESCO figure of 3,754 tons of carbon, the stock would be about 3.75 million tons. This is a round, illustrative calculation. Actual storage varies by site and soil, so planners measure it locally.
Who is affected, and how the day is marked
The people who lose most when mangroves disappear are those who live closest to the water: fishing families, small farmers and coastal communities with few other defenses. UNESCO notes that mangroves contribute to food security, wellbeing and the protection of coastal communities. Its MangRes project, running from 2022 to 2025, helps communities restore and conserve mangroves in biosphere reserves in Latin America and the Caribbean, and the day sits within the UN Decade on Ecosystem Restoration 2021 to 2030. On July 26 schools, scientists, coastal communities and agencies hold planting events, talks and exhibitions. Since no single annual theme is confirmed on the UNESCO page, check the official observance page for the current year’s focus.
Key Takeaways
- The day is UNESCO’s. It was proclaimed in November 2015 and first observed on July 26, 2016.
- Mangroves are a global ecosystem. FAO counts 14.8 million hectares in 123 countries and territories in 2020.
- Loss is real but slowing. Net decline fell from 18.2 to 10.2 thousand hectares a year between the two decades.
- Regrowth counts. New growth offset more than half of the 677,000 hectares lost from 2000 to 2020.
- They shield coasts. A World Bank study in Jamaica found mangroves cut flood losses by nearly 50 percent in a 200-year storm.
- They hold carbon. UNESCO says one hectare can store 3,754 tons of carbon.
- Protecting them is practical. Standing mangroves protect homes, fisheries and climate at once, so ask what protects the nearest coast.
How solid is this? Area and loss figures come from FAO’s 2023 report and cover 2000 to 2020. The 40-year loss estimate and the carbon, emissions and wave figures are UNESCO’s as published and carry no stated year or source on its page. The flood and fishery numbers come from one 2019 World Bank study of Jamaica and should not be applied to other coasts. The three worked examples use round, made-up numbers. See also the International Days hub and the International Days Calendar.
More in Nature
- UNESCO, International Day for the Conservation of the Mangrove Ecosystem
- UN News, On first International Day, UNESCO calls for protection of mangrove ecosystems (2016)
- FAO, The World’s Mangroves 2000–2020 report is now out (2023)
- FAO, Global effort to safeguard mangroves steps up (2023)
- World Bank, Forces of Nature: Coastal Resilience Benefits of Mangroves in Jamaica (2019)