A flood is a hazard. A flood that sweeps through a town with no warning, no drainage and homes built on the river bank is a disaster. The difference between the two is not luck. It is a set of choices made long before the water rises, and the International Day for Disaster Risk Reduction, observed every October 13, exists to put those choices in the open. The day asks a plain question: what would it take to stop dangerous events from becoming human tragedies? As the evidence below shows, the answer is cheaper and more achievable than most people expect. Many of the hazards involved, such as floods and droughts, also run through World Water Day.
A call from the General Assembly in 1989
The day was started in 1989, after a call by the United Nations General Assembly for a day to promote a global culture of risk awareness and disaster reduction. It is held every October 13. For years it worked mainly as an awareness date. It gained a sharper purpose in 2015, when governments met at the Third UN World Conference on Disaster Risk Reduction in Sendai, Japan, and agreed the Sendai Framework for Disaster Risk Reduction 2015 to 2030. The framework sets seven global targets and aims at significantly reducing disaster risk and losses by 2030. Since then the day has served as a yearly checkpoint on that promise. The years 2026 to 2030 are the final five years of the framework’s implementation, which gives each coming observance a note of urgency.
A hazard is not a disaster
Three words carry most of the idea. A hazard is the event itself: an earthquake, a cyclone, a heat wave. Exposure is how many people and how much property stand in its path. Vulnerability is how easily they are harmed. UNDRR’s flagship report makes the point directly: disasters arise not just from hazards, but from underlying vulnerabilities or heightened exposure that let a hazard escalate into a humanitarian crisis. We cannot stop an earthquake. We can change where homes are built, how they are built, and whether families know what to do when the ground shakes.
Example 1: two towns, one storm. Imagine the same storm reaches two coastal towns of 10,000 people each. Town A has early warnings, working drains and sensible building rules, and its residents know where to go. Town B has none of these. The storm is identical, yet Town A counts damaged roofs while Town B counts lives and livelihoods lost. The numbers are round and made up, but the gap between the towns is the one the day is about.
The numbers behind the day
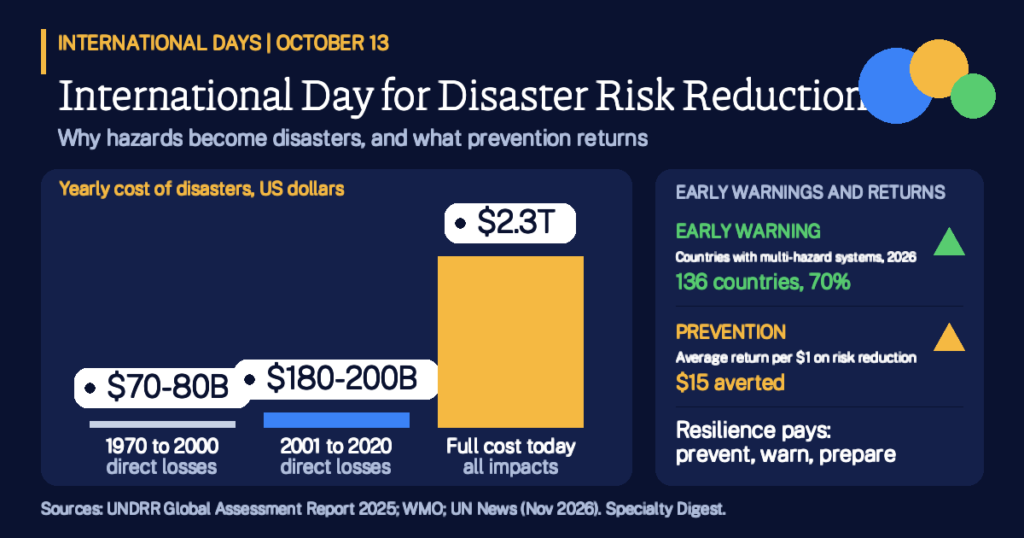
UNDRR’s Global Assessment Report 2025, titled Resilience Pays, puts a price on the problem. Direct costs of disasters averaged $70 to $80 billion a year between 1970 and 2000, then grew to $180 to $200 billion a year between 2001 and 2020. Direct losses are only the visible part. Once cascading and ecosystem costs are counted, the report says disaster costs now exceed $2.3 trillion annually, nearly ten times the direct losses in official figures. UNDRR’s 2025 annual report puts that at roughly 2 percent of global GDP.
People pay as well. The UN reports that around 100 million people were affected by disasters each year on average between 2016 and 2025. There is encouraging news too: the Global Assessment Report notes that disaster mortality rates per 100,000 people have fallen by roughly 50 percent since 2005. Better warnings, stronger buildings and better preparation are a large part of why.
- $2.3 trillionyearly cost of disasters with cascading and ecosystem impacts (GAR 2025)
- 100 millionpeople affected per year on average, 2016 to 2025
- About 50%fall in mortality rate per 100,000 people since 2005
- 2%share of aid that targets disaster risk reduction (GAR 2025)
Warnings that save lives
An early warning is one of the simplest protections there is: a message that reaches people in time to move. The Early Warnings for All initiative aims to protect every person on Earth with an early warning system by 2027. In November 2025 the World Meteorological Organization reported that 119 countries, or 60 percent, had a multi-hazard early warning system, a 113 percent increase over ten years. Coverage was uneven: 72 percent in Asia-Pacific, 51 percent in the Americas and Caribbean, and only 43 percent among small island developing States.
A year later, the Global Status of Multi-Hazard Early Warning Systems 2026 counted 136 countries, or 70 percent, which is 17 more than in March 2025. Around one in three countries still has none. The payoff is visible in the data: countries with substantial to comprehensive systems recorded disaster mortality 6.1 times lower than those with limited to moderate ones.
Example 2: six hours to move. Suppose a river town of 10,000 people receives a flood warning six hours ahead. If sirens, phone alerts and neighborhood volunteers reach 9,000 residents, most can get to higher ground. If only 4,000 hear it, thousands are caught unaware. The figures are illustrative, but they show why a warning only works when it reaches people and when people know what to do next.
Why prevention pays
The central finding of the Global Assessment Report 2025 is in its title: resilience pays. It reports that each $1 spent on disaster risk reduction delivers an average return of $15 in averted future disaster recovery costs, and it cites benefit-cost ratios ranging from 2 to 1 up to 10 to 1 or more. Yet the same report notes that aid targeting disaster risk reduction sits at about 2 percent, and that pre-arranged financing is a very small fraction of crisis funding. That gap is the logic behind the 2025 theme, Fund resilience, not disasters.
Example 3: a city weighs its budget. Imagine a city considers a $20 million program to retrofit schools and clear drainage channels. At a 4 to 1 benefit-cost ratio, which sits inside the reported 2 to 1 to 10 to 1 range, the program would avoid about $80 million in losses over time. The numbers are rounded and illustrative, and real ratios vary by hazard and place, but the arithmetic shows why prevention is often the better buy.
Who is left behind, and how the day is marked
Risk is not shared evenly. In 2025, only 43 percent of small island developing States reported a multi-hazard early warning system, against 60 percent of all countries. Where poverty, weak housing and thin public services meet a hazard, the damage multiplies. That is why the day looks beyond engineering to households, schools and local governments.
Governments, schools, businesses and community groups mark October 13 with drills, exhibitions, training and local events, and UNDRR invites partners to share their activities. Each year carries a theme. The UN observance page says the 2026 day focuses on Resilience Starts at Home. You can act on it with three small steps: learn which hazards affect your area, agree a plan with your household for where to go and whom to call, and sign up for local alerts.
- 2024Empowering the next generation for a resilient future
- 2025Fund resilience, not disasters
- 2026Resilience Starts at Home
Key Takeaways
- Hazards become disasters through people’s choices. Exposure and vulnerability can be reduced, even when the hazard cannot.
- The true cost is far larger than reported. Disasters cost over $2.3 trillion a year once cascading and ecosystem costs count, nearly ten times direct losses.
- Progress is real. Mortality rates per 100,000 have fallen by roughly 50 percent since 2005.
- Warnings work. 136 countries, 70 percent, reported multi-hazard systems in 2026, and mortality is 6.1 times lower where systems are strong.
- Prevention is a bargain. The Global Assessment Report finds an average return of $15 for each $1 spent on risk reduction.
- Start at home. Know your local hazards, make a household plan and sign up for local alerts.
How solid is this? Cost figures are estimates from UNDRR’s Global Assessment Report 2025 and combine reported and modeled values. Early warning counts are self-reported by countries and differ by report edition, so 2025 and 2026 figures are labeled by year. The $15 average return and the benefit-cost ratios are separate measures and should not be compared like for like. The three worked examples use round, made-up numbers to show an idea. See also World Water Day, the International Days hub and the International Days Calendar.
More in Society
- United Nations. International Day for Disaster Risk Reduction, observance page.
- UNDRR. Global Assessment Report on Disaster Risk Reduction 2025: Resilience Pays.
- UNDRR. UNDRR 2025 Annual Report.
- WMO. Global Status of Multi-Hazard Early Warning Systems 2025 (12 November 2025).
- WMO. Early warning systems reach new heights, but critical gaps jeopardize global progress (12 November 2025).
- UN News. From Japan to Rwanda, early warnings are saving lives (11 November 2026).
- UNDRR. About the day, International Day for Disaster Risk Reduction.